
Page 1180 - How to Make Money in Stocks Trilogy
P. 1180
Don’t Invest Blindly: Use Charts to See the Best Time to Buy and Sell 163
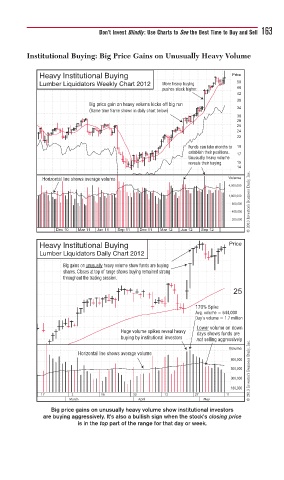
Institutional Buying: Big Price Gains on Unusually Heavy Volume
Heavy Institutional Buying Price
Lumber Liquidators Weekly Chart 2012 More heavy buying 50
pushes stock higher. 46
42
38
Big price gain on heavy volume kicks off big run
34
(Same time frame shown in daily chart below)
30
28
26
24
22
Funds can take months to 19
establish their positions. 17
Unusually heavy volume
reveals their buying. 15
14
© 2013 Investor’s Business Daily, Inc.
Horizontal line shows average volume Volume
4,000,000
1,600,000
800,000
400,000
200,000
Dec 10 Mar 11 Jun 11 Sep 11 Dec 11 Mar 12 Jun 12 Sep 12
Heavy Institutional Buying Price
Lumber Liquidators Daily Chart 2012
Big gains on unusually heavy volume show funds are buying
shares. Closes at top of range shows buying remained strong
throughout the trading session.
25
170% Spike
Avg. volume = 644,000
Day’s volume = 1.7 million
Lower volume on down
Huge volume spikes reveal heavy days shows funds are
buying by institutional investors
not selling aggressively
Volume
Horizontal line shows average volume
800,000
500,000 © 2013 Investor’s Business Daily, Inc.
300,000
180,000
17 2 16 30 13 27 11
March April May
Big price gains on unusually heavy volume show institutional investors
are buying aggressively. It’s also a bullish sign when the stock’s closing price
is in the top part of the range for that day or week.