
Page 1181 - How to Make Money in Stocks Trilogy
P. 1181
164 HOW TO MAKE MONEY IN STOCKS—GETTING STARTED
Institutional Selling: Big Price Drops on Unusually Heavy Volume
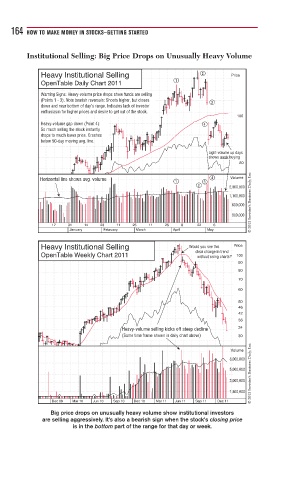
Heavy Institutional Selling 2 Price
1
OpenTable Daily Chart 2011
Warning Signs: Heavy-volume price drops show funds are selling
(Points 1 - 3). Note bearish reversals: Shoots higher, but closes 3
down and near bottom of day’s range. Indicates lack of investor
enthusiasm for higher prices and desire to get out of the stock.
100
Heavy-volume gap down (Point 4): 4
So much selling the stock instantly
drops to much lower price. Crashes
below 50-day moving avg. line.
Light-volume up days
shows weak buying
80
© 2013 Investor’s Business Daily, Inc.
Horizontal line shows avg. volume 4 Volume
1 3
2 2,000,000
1,100,000
600,000
300,000
17 31 14 28 11 25 11 25 8 22 6
January February March April May
Heavy Institutional Selling Would you see this Price
clear change in trend
OpenTable Weekly Chart 2011 without using charts? 100
90
80
70
60
50
46
42
38
Heavy-volume selling kicks off steep decline 34
(Same time frame shown in daily chart above) 30
© 2013 Investor’s Business Daily, Inc.
Volume
8,000,000
5,000,000
3,000,000
1,800,000
Dec 09 Mar 10 Jun 10 Sep 10 Dec 10 Mar 11 Jun 11 Sep 11 Dec 11
Big price drops on unusually heavy volume show institutional investors
are selling aggressively. It’s also a bearish sign when the stock’s closing price
is in the bottom part of the range for that day or week.