
Page 1204 - How to Make Money in Stocks Trilogy
P. 1204
Don’t Invest Blindly: Use Charts to See the Best Time to Buy and Sell 187
Double Bottom
Second Most Common Pattern
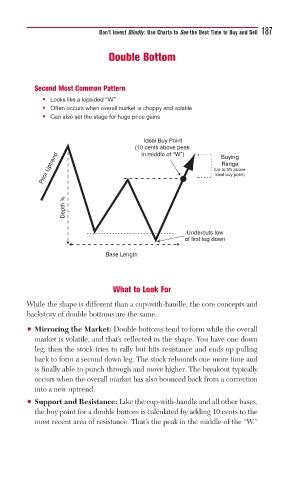
• Looks like a lopsided “W”
• Often occurs when overall market is choppy and volatile
• Can also set the stage for huge price gains
Ideal Buy Point
(10 cents above peak Buying
Prior Uptrend (Up to 5% above
in middle of “W”)
Range
ideal buy point)
Depth %
Undercuts low
of first leg down
Base Length
What to Look For
While the shape is different than a cup-with-handle, the core concepts and
backstory of double bottoms are the same.
• Mirroring the Market: Double bottoms tend to form while the overall
market is volatile, and that’s reflected in the shape. You have one down
leg, then the stock tries to rally but hits resistance and ends up pulling
back to form a second down leg. The stock rebounds one more time and
is finally able to punch through and move higher. The breakout typically
occurs when the overall market has also bounced back from a correction
into a new uptrend.
• Support and Resistance: Like the cup-with-handle and all other bases,
the buy point for a double bottom is calculated by adding 10 cents to the
most recent area of resistance. That’s the peak in the middle of the “W.”