
Page 1206 - How to Make Money in Stocks Trilogy
P. 1206
Don’t Invest Blindly: Use Charts to See the Best Time to Buy and Sell 189
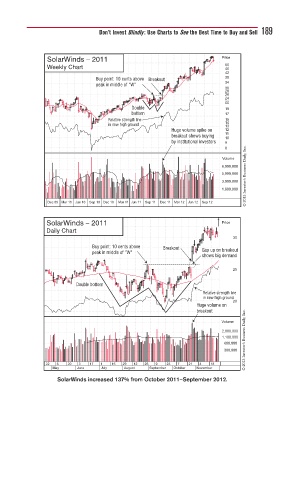
SolarWinds – 2011 Price
Weekly Chart 50
46
42
Buy point: 10 cents above Breakout 38
peak in middle of “W” 34
30
28
26
24
22
Double 19
bottom 17
Relative strength line 15
in new high ground 14
13
Huge volume spike on 12
breakout shows buying 11
10
by institutional investors 9
© 2013 Investor’s Business Daily, Inc.
8
Volume
8,000,000
5,000,000
3,000,000
1,800,000
Dec 09 Mar 10 Jun 10 Sep 10 Dec 10 Mar 11 Jun 11 Sep 11 Dec 11 Mar 12 Jun 12 Sep 12
SolarWinds – 2011 Price
Daily Chart
30
Buy point: 10 cents above Breakout
peak in middle of “W” Gap up on breakout
shows big demand
25
Double bottom
Relative strength line
in new high ground
20
Huge volume on
breakout
© 2013 Investor’s Business Daily, Inc.
Volume
2,000,000
1,100,000
600,000
300,000
22 6 20 3 17 1 15 29 12 26 9 23 7 21 4 18
May June July August September October November
SolarWinds increased 137% from October 2011–September 2012.