
Page 1208 - How to Make Money in Stocks Trilogy
P. 1208
Don’t Invest Blindly: Use Charts to See the Best Time to Buy and Sell 191
Faulty Double Bottoms
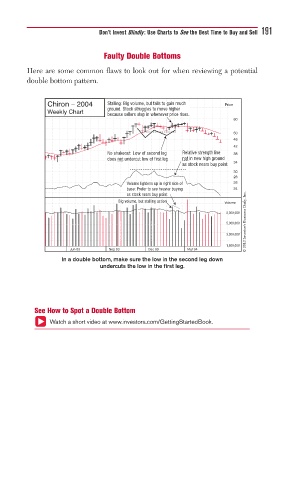
Here are some common flaws to look out for when reviewing a potential
double bottom pattern.
Chiron – 2004 Stalling: Big volume, but fails to gain much Price
ground. Stock struggles to move higher
Weekly Chart
because sellers step in whenever price rises.
60
50
46
42
No shakeout: Low of second leg Relative strength line 38
does not undercut low of first leg not in new high ground
as stock nears buy point 34
30
28
Volume lightens up in right side of 26
base: Prefer to see heavier buying 24
© 2013 Investor’s Business Daily, Inc.
as stock nears buy point
Big volume, but stalling action
Volume
8,000,000
5,000,000
3,000,000
1,800,000
Jun 03 Sep 03 Dec 03 Mar 04
In a double bottom, make sure the low in the second leg down
undercuts the low in the first leg.
See How to Spot a Double Bottom
Watch a short video at www.investors.com/GettingStartedBook.