
Page 1235 - How to Make Money in Stocks Trilogy
P. 1235
Don’t Invest Blindly: Use Charts to See the Best Time to Buy and Sell 217
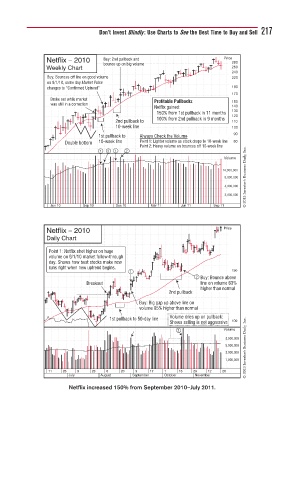
Netflix – 2010 Buy: 2nd pullback and Price
bounce up on big volume 280
Weekly Chart 260
240
Buy: Bounces off line on good volume 220
on 9/1/10, same day Market Pulse
changes to “Confirmed Uptrend” 190
170
Broke out while market Profitable Pullbacks 150
was still in a correction
Netflix gained: 140
150% from 1st pullback in 11 months 130
100% from 2nd pullback in 9 months 120
2nd pullback to 110
10-week line 100
1st pullback to Always Check the Volume 90
Double bottom 10-week line Point 1: Lighter volume as stock drops to 10-week line 80
Point 2: Heavy volume on bounces off 10-week line
© 2013 Investor’s Business Daily, Inc.
1 2 1 2
Volume
14,000,000
8,000,000
4,000,000
2,000,000
Jun 10 Sep 10 Dec 10 Mar 11 Jun 11 Sep 11
Netflix – 2010 Price
Daily Chart
Point 1: Netflix shot higher on huge
volume on 9/1/10 market follow-through
day. Shows how best stocks make new
runs right when new uptrend begins.
1 150
2 Buy: Bounce above
Breakout line on volume 63%
higher than normal
2nd pullback
Buy: Big gap up above line on
volume 85% higher than normal
Volume dries up on pullback:
1st pullback to 50-day line
© 2013 Investor’s Business Daily, Inc.
Shows selling is not aggressive 100
2 Volume
8,000,000
5,000,000
3,000,000
1,800,000
11 25 9 23 6 20 3 17 1 15 29 12 26
July August September October November
Netflix increased 150% from September 2010–July 2011.