
Page 1237 - How to Make Money in Stocks Trilogy
P. 1237
Don’t Invest Blindly: Use Charts to See the Best Time to Buy and Sell 219
Using Charts to Go Through the Checklists
In the Buying Checklist and Selling Checklist sections we covered earlier,
you saw how to quickly run through most of the buying and selling criteria
using Stock Checkup and some basic rules.
Now that we’ve also covered the basics of chart-reading, let’s see how to
go through the “Chart Analysis” items on both checklists.
It Pays to Practice
If you’re brand new to charts, I’m sure you’re still trying to absorb all the
patterns and concepts we just went through. As I keep saying—and as I
know from personal experience—it takes a little time for it all to sink in and
come together. But whatever you do, don’t give up on chart-reading!
The practice you put in now will pay off down the road. So stick with it.
Keep doing the Simple Weekend Routine, and keep watching the Daily
Stock Analysis and other IBD TV videos. Spotting buy and sell signals in a
chart will soon become second nature.
Let’s start right now with a quick run through the Buying Checklist.
Buying Checklist
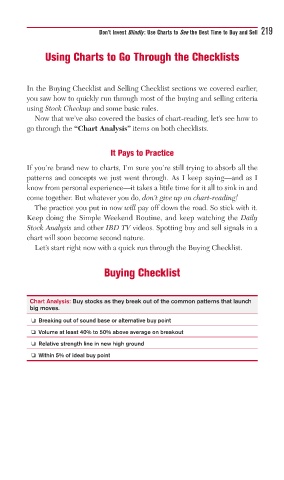
Chart Analysis: Buy stocks as they break out of the common patterns that launch
big moves.
❏ Breaking out of sound base or alternative buy point
❏ Volume at least 40% to 50% above average on breakout
❏ Relative strength line in new high ground
❏ Within 5% of ideal buy point