
Page 1240 - How to Make Money in Stocks Trilogy
P. 1240
222 HOW TO MAKE MONEY IN STOCKS—GETTING STARTED
• Check the daily chart.
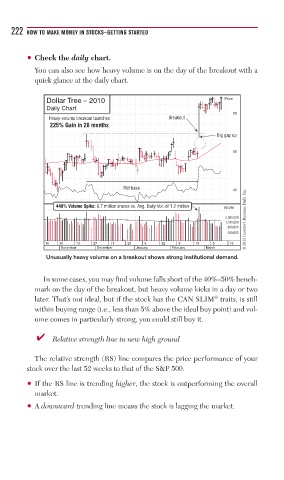
You can also see how heavy volume is on the day of the breakout with a
quick glance at the daily chart.
Dollar Tree – 2010 Price
Daily Chart
55
Heavy-volume breakout launches Breakout
225% Gain in 28 months
Big gap up
50
Flat base
© 2013 Investor’s Business Daily, Inc.
45
448% Volume Spike: 6.7 million shares vs. Avg. Daily Vol. of 1.2 million Volume
2,000,000
1,100,000
600,000
300,000
16 30 13 27 11 25 8 22 5 19 5 19
November December January February March
Unusually heavy volume on a breakout shows strong institutional demand.
In some cases, you may find volume falls short of the 40%–50% bench-
mark on the day of the breakout, but heavy volume kicks in a day or two
®
later. That’s not ideal, but if the stock has the CAN SLIM traits, is still
within buying range (i.e., less than 5% above the ideal buy point) and vol-
ume comes in particularly strong, you could still buy it.
■ ✔ Relative strength line in new high ground
The relative strength (RS) line compares the price performance of your
stock over the last 52 weeks to that of the S&P 500.
• If the RS line is trending higher, the stock is outperforming the overall
market.
• A downward trending line means the stock is lagging the market.