
Page 1231 - How to Make Money in Stocks Trilogy
P. 1231
Don’t Invest Blindly: Use Charts to See the Best Time to Buy and Sell 213
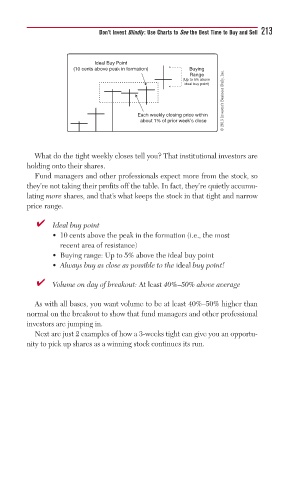
Ideal Buy Point
(10 cents above peak in formation) Buying
© 2013 Investor’s Business Daily, Inc.
Range
(Up to 5% above
ideal buy point)
Each weekly closing price within
about 1% of prior week’s close
What do the tight weekly closes tell you? That institutional investors are
holding onto their shares.
Fund managers and other professionals expect more from the stock, so
they’re not taking their profits off the table. In fact, they’re quietly accumu-
lating more shares, and that’s what keeps the stock in that tight and narrow
price range.
■ ✔ Ideal buy point
• 10 cents above the peak in the formation (i.e., the most
recent area of resistance)
• Buying range: Up to 5% above the ideal buy point
• Always buy as close as possible to the ideal buy point!
■ ✔ Volume on day of breakout: At least 40%–50% above average
As with all bases, you want volume to be at least 40%–50% higher than
normal on the breakout to show that fund managers and other professional
investors are jumping in.
Next are just 2 examples of how a 3-weeks tight can give you an opportu-
nity to pick up shares as a winning stock continues its run.