Page 1232 - How to Make Money in Stocks Trilogy
P. 1232

214  HOW TO MAKE MONEY IN STOCKS—GETTING STARTED


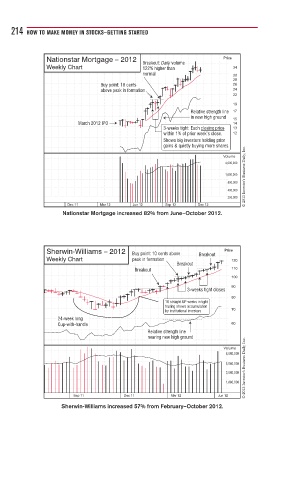
              Nationstar Mortgage – 2012                        Price
                                         Breakout: Daily volume
              Weekly Chart               122% higher than         34
                                         normal                   30
                                                                  28
                             Buy point: 10 cents                  26
                             above peak in formation              24
                                                                  22
                                                                  19
                                                      Relative strength line  17
                                                      in new high ground
                                                                  15
                       March 2012 IPO                             14
                                               3-weeks tight: Each closing price   13
                                               within 1% of prior week’s close.  12
                                               Shows big investors holding prior
                                               gains & quietly buying more shares.
                                                                      © 2013 Investor’s Business Daily, Inc.
                                                                Volume
                                                                4,000,000
                                                                1,600,000
                                                                 800,000
                                                                 400,000
                                                                 200,000
                    Dec 11   Mar 12   Jun 12   Sep 12   Dec 12
                   Nationstar Mortgage increased 82% from June–October 2012.


              Sherwin-Williams – 2012  Buy point: 10 cents above   Breakout  Price
              Weekly Chart            peak in formation           120
                                                   Breakout
                                       Breakout                   110
                                                                  100
                                                                  90
                                                     3-weeks tight closes
                                                                  80
                                               16 straight UP weeks in tight
                                               trading shows accumulation
                                               by institutional investors  70
                 24-week long
                 Cup-with-handle                                  60
                                          Relative strength line
                                          nearing new high ground
                                                                      © 2013 Investor’s Business Daily, Inc.
                                                                Volume
                                                                8,000,000
                                                                5,000,000
                                                                3,000,000
                                                                1,800,000
                      Sep 11        Dec 11       Mar 12       Jun 12
                  Sherwin-Williams increased 57% from February–October 2012.
   1227   1228   1229   1230   1231   1232   1233   1234   1235   1236   1237