
Page 1241 - How to Make Money in Stocks Trilogy
P. 1241
Don’t Invest Blindly: Use Charts to See the Best Time to Buy and Sell 223
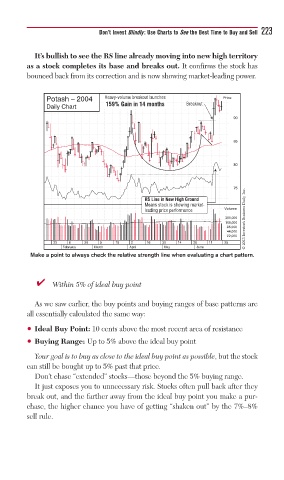
It’s bullish to see the RS line already moving into new high territory
as a stock completes its base and breaks out. It confirms the stock has
bounced back from its correction and is now showing market-leading power.
Potash – 2004 Heavy-volume breakout launches Price
Daily Chart 159% Gain in 14 months Breakout
90
85
80
75
RS Line in New High Ground
Means stock is showing market-
leading price performance Volume
350,000 © 2013 Investor’s Business Daily, Inc.
168,000
86,000
44,000
22,000
23 6 20 5 19 2 16 30 14 28 11 25
February March April May June
Make a point to always check the relative strength line when evaluating a chart pattern.
■ ✔ Within 5% of ideal buy point
As we saw earlier, the buy points and buying ranges of base patterns are
all essentially calculated the same way:
• Ideal Buy Point: 10 cents above the most recent area of resistance
• Buying Range: Up to 5% above the ideal buy point
Your goal is to buy as close to the ideal buy point as possible, but the stock
can still be bought up to 5% past that price.
Don’t chase “extended” stocks—those beyond the 5% buying range.
It just exposes you to unnecessary risk. Stocks often pull back after they
break out, and the farther away from the ideal buy point you make a pur-
chase, the higher chance you have of getting “shaken out” by the 7%–8%
sell rule.