
Page 1242 - How to Make Money in Stocks Trilogy
P. 1242
224 HOW TO MAKE MONEY IN STOCKS—GETTING STARTED
So if you miss a breakout, resist the temptation to chase that train down
the tracks. Instead, wait for it to pull into the next station by forming a new
base or alternative buy point like a pullback or 3-weeks tight. That allows
you to board the train more safely and sensibly.
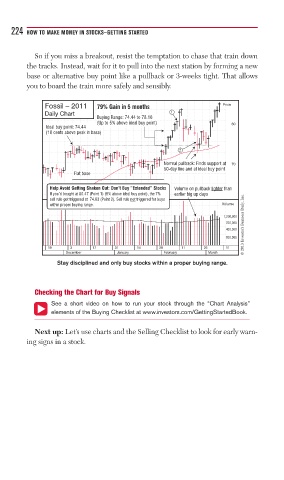
Fossil – 2011 79% Gain in 5 months Price
Daily Chart 1
Buying Range: 74.44 to 78.16
(Up to 5% above ideal buy point)
Ideal buy point: 74.44 80
(10 cents above peak in base)
2
Normal pullback: Finds support at 70
50-day line and at ideal buy point
Flat base
Help Avoid Getting Shaken Out: Don’t Buy “Extended” Stocks Volume on pullback lighter than
If you’d bought at 80.47 (Point 1) (8% above ideal buy point), the 7% earlier big up days
© 2013 Investor’s Business Daily, Inc.
sell rule got triggered at 74.83 (Point 2). Sell rule not triggered for buys
within proper buying range. Volume
1,200,000
700,000
400,000
200,000
19 3 17 31 14 28 11 25 11
December January February March
Stay disciplined and only buy stocks within a proper buying range.
Checking the Chart for Buy Signals
See a short video on how to run your stock through the “Chart Analysis”
elements of the Buying Checklist at www.investors.com/GettingStartedBook.
Next up: Let’s use charts and the Selling Checklist to look for early warn-
ing signs in a stock.