
Page 237 - How to Make Money in Stocks Trilogy
P. 237
How to Read Charts Like a Pro and Improve Your Selection and Timing 119
Microsoft Price
140
Weekly Chart 120
100
80
70
60
V V Veery strong price action iy strong price actionoeng ps i
o on enon enormous volumeuous
45
38
32
IPOOP 28
* * 24
20
Volume dry-up Heaviest volume weekvolume weekweemest voe k k 17
Heaviest
since going publicgoing publiccublicgoingn
along pattern lows since 15
Volume © 2009 Investor’s Business Daily, Inc.
920,000
560,000
340,000
200,000
Dec 1985 Mar 1986 Jun 1986 Sep 1986 Dec 1986 Mar 1987 Jun 1987
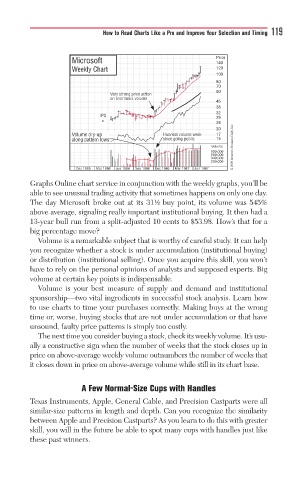
Graphs Online chart service in conjunction with the weekly graphs, you’ll be
able to see unusual trading activity that sometimes happens on only one day.
The day Microsoft broke out at its 31½ buy point, its volume was 545%
above average, signaling really important institutional buying. It then had a
13-year bull run from a split-adjusted 10 cents to $53.98. How’s that for a
big percentage move?
Volume is a remarkable subject that is worthy of careful study. It can help
you recognize whether a stock is under accumulation (institutional buying)
or distribution (institutional selling). Once you acquire this skill, you won’t
have to rely on the personal opinions of analysts and supposed experts. Big
volume at certain key points is indispensable.
Volume is your best measure of supply and demand and institutional
sponsorship—two vital ingredients in successful stock analysis. Learn how
to use charts to time your purchases correctly. Making buys at the wrong
time or, worse, buying stocks that are not under accumulation or that have
unsound, faulty price patterns is simply too costly.
The next time you consider buying a stock, check its weekly volume. It’s usu-
ally a constructive sign when the number of weeks that the stock closes up in
price on above-average weekly volume outnumbers the number of weeks that
it closes down in price on above-average volume while still in its chart base.
A Few Normal-Size Cups with Handles
Texas Instruments, Apple, General Cable, and Precision Castparts were all
similar-size patterns in length and depth. Can you recognize the similarity
between Apple and Precision Castparts? As you learn to do this with greater
skill, you will in the future be able to spot many cups with handles just like
these past winners.