
Page 238 - How to Make Money in Stocks Trilogy
P. 238
120 A WINNING SYSTEM
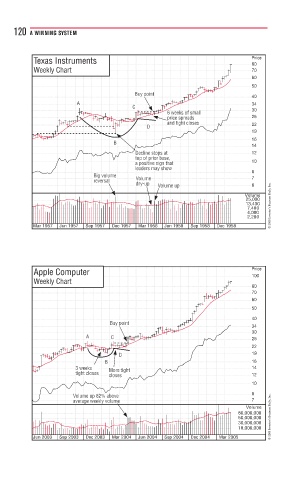
Texas Instruments Price
80
Weekly Chart 70
60
50
Buy p t
Buy point
40
A A 34
C C
6 6 weeks of smallf sma
6 weeks of smallkkk ff ll 30
price
price spreadsspreadssprear 26
and tight closesgght cn e 22
D D
19
16
B
14
D
Decline stops at stops attopsn
Decline 12
top of prior base,or baf
t
a a positive sign thatiti e signs i tha t tt 10
l leaders may showwmay sr
8
Big volumeg v u 7
reversalle V V Volumeolumem e e
d dry-upypu p p V Volume uppolume upolume upmo 6
Volume
25,000
13,400 © 2009 Investor’s Business Daily, Inc.
7,400
4,000
2,200
Mar 1957 Jun 1957 Sep 1957 Dec 1957 Mar 1958 Jun 1958 Sep 1958 Dec 1958
Apple Computer Price
100
Weekly Chart
80
70
60
50
40
Buy pointtp t
34
30
A C C 26
22
D D D 19
B B 16
3 weeksweekse M M t ht h 14
3
More tightti
tight closesg tight s s
c closes 12
closess
10
8
82% bb
V V Volume up 82% abovel m p 82%
average weekly volumevolumeo
average weekly volumeeyweeklyeeklyav
average 7
Volume
80,000,000
50,000,000 © 2009 Investor’s Business Daily, Inc.
30,000,000
18,000,000
Jun 2003 Sep 2003 Dec 2003 Mar 2004 Jun 2004 Sep 2004 Dec 2004 Mar 2005