
Page 445 - How to Make Money in Stocks Trilogy
P. 445
More Models of Great Stock Market Winners 315
forming the market. All the models show the stock’s chart pattern just
before the point where you want to take buying action.
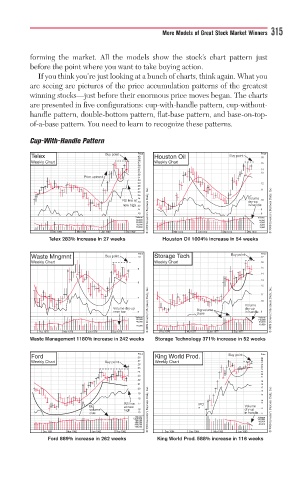
If you think you’re just looking at a bunch of charts, think again. What you
are seeing are pictures of the price accumulation patterns of the greatest
winning stocks—just before their enormous price moves began. The charts
are presented in five configurations: cup-with-handle pattern, cup-without-
handle pattern, double-bottom pattern, flat-base pattern, and base-on-top-
of-a-base pattern. You need to learn to recognize these patterns.
Cup- With- Handle Pattern
Buy pointn
Telex Buy pointnuu Price Houston Oil Buy poin Price
Buy pointpp
40
16
39
Weekly Chart 38 37 Weekly Chart 15
36
35
34 14
33 13
32
P P P P P P P P Prior urior uuuptrenddnriori uptrenddnu u uptrend 31
30
29 12
28
27 11
26
25
24 V Volumeolume
R RS at 23 d dry-up 10
RS line ali
n new
new 22 in in handle handl
n
new high
new highhighhigh
21 © 2009 Investor’s Business Daily, Inc. 9 © 2009 Investor’s Business Daily, Inc.
20 8
Volume Volume
80,000 14,000
50,000 8,000
30,000 4,000
18,000 2,000
Dec 1968 Mar 1969 Jun 1969 Sep 1969 Mar 1972 Jun 1972 Sep 1972 Dec 1972
Telex 283% increase in 27 weeks Houston Oil 1004% increase in 54 weeks
Price B Buy point Price
B
Buy pointii
Waste Mngmnt Buy poin t t 10 Storage Tech 17
Buy
poin
Weekly Chart Weekly Chart 16
15
9
14
13
8
12
© 2009 Investor’s Business Daily, Inc. Big volumug me © 2009 Investor’s Business Daily, Inc.
7 11 10
Volume ddm r upy-u Volumel
dry-upy
near lowlow
near 6 clulu ues in in handlhandlh le le 9
Volume Volume
60,000 140,000
40,000 80,000
20,000 40,000
Dec 1975 Mar 1976 Jun 1976 Sep 1976 Dec 1976 Mar 1977 Jun 1977 Sep 1977
Waste Management 1180% increase in 242 weeks Storage Technology 371% increase in 52 weeks
Price Buy point Price
Buy pointpp
Ford 28 King World Prod. 29
Weekly Chart Buy 27 Weekly Chart 28 27
Buy pointtpointou
Buy point
26 26
25
25 24
24 23
22
23
21
22
19
21 18
20 17 16
19 15
18 14
RS lineline
RS e e 17 IPO O O 13
R
IPO
B B Bi B Big a at new w Volume
v v v
volumee h high 16 © 2009 Investor’s Business Daily, Inc. * d drry-upyup 12 © 2009 Investor’s Business Daily, Inc.
volume
high
g
cue
clue
c c c
c clue 15 in in handlhandl le le 11
Volume
Volume
1,200,000 140,000
760,000 80,000
480,000
300,000 40,000
180,000
Dec 1981 Mar 1982 Jun 1982 Sep 1982 Sep 1984 Dec 1984 Mar 1985 Jun 1985
Ford 889% increase in 262 weeks King World Prod. 588% increase in 116 weeks