
Page 272 - SK Year 5 Mathematics DLP
P. 272
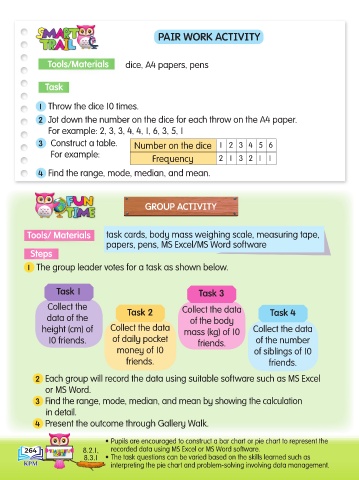
PAIR WORK ACTIVITY


                    Tools/Materials         dice, A4 papers, pens


                   Task


                 1  Throw the dice 10 times.

                 2   Jot down the number on the dice for each throw on the A4 paper.
                    For example: 2, 3, 3, 4, 4, 1, 6, 3, 5, 1

                 3   Construct a table.       Number on the dice 1 2 3 4 5 6
                     For example:
                                                    Frequency           2 1 3 2 1 1


                 4   Find the range, mode, median, and mean.

                                                 GROUP ACTIVITY


              Tools/ Materials        task cards, body mass weighing scale, measuring tape,
                                      papers, pens, MS Excel/MS Word software
               Steps
              1   The group leader votes for a task as shown below.


                       Task 1                                    Task 3

                    Collect the                              Collect the data
                    data of the             Task 2             of the body             Task 4
                  height (cm) of       Collect the data      mass (kg) of 10      Collect the data
                    10 friends.         of daily pocket          friends.          of the number
                                         money of 10                              of siblings of 10
                                            friends.                                   friends.

                2   Each group will record the data using suitable software such as MS Excel
                   or MS Word.
                3  Find the range, mode, median, and mean by showing the calculation
                    in detail.

                4  Present the outcome through Gallery Walk.

                                     • Pupils are encouraged to construct a bar chart or pie chart to represent the
             264               8.2.1,   recorded data using MS Excel or MS Word software.
                               8.3.1  • The task questions can be varied based on the skills learned such as
                                       interpreting the pie chart and problem-solving involving data management.