Page 267 - SK Year 5 Mathematics DLP
P. 267

SOLVE THE PROBLEMS
                                                                              Height in metre

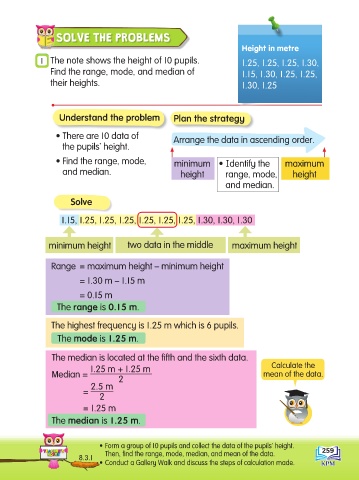
                  1  The note shows the height of 10 pupils.                  1.25, 1.25, 1.25, 1.30,
                     Find the range, mode, and median of                      1.15, 1.30, 1.25, 1.25,
                     their heights.                                           1.30, 1.25


                        Understand the problem            Plan the strategy


                       • There are 10 data of             Arrange the data in ascending order.
                          the pupils’ height.
                       • Find the range, mode,            minimum  •  Identify the         maximum
                          and median.                       height        range, mode,        height

                                                                          and median.

                           Solve

                        1.15, 1.25, 1.25, 1.25, 1.25, 1.25, 1.25, 1.30, 1.30, 1.30


                    minimum height          two data in the middle          maximum height


                     Range = maximum height – minimum height

                              = 1.30 m – 1.15 m

                              = 0.15 m
                       The range is 0.15 m.

                     The highest frequency is 1.25 m which is 6 pupils.

                       The mode is 1.25 m.

                     The median is located at the fifth and the sixth data.
                                 1.25 m + 1.25 m                                       Calculate the
                     Median =                                                        mean of the data.
                                         2
                                 2.5 m
                               =
                                    2
                               = 1.25 m
                     The median is 1.25 m.


                                    • Form a group of 10 pupils and collect the data of the pupils’ height.   259
                                     Then, find the range, mode, median, and mean of the data.
                              8.3.1
                                    • Conduct a Gallery Walk and discuss the steps of calculation made.
   262   263   264   265   266   267   268   269   270   271   272