
Page 271 - SK Year 5 Mathematics DLP
P. 271
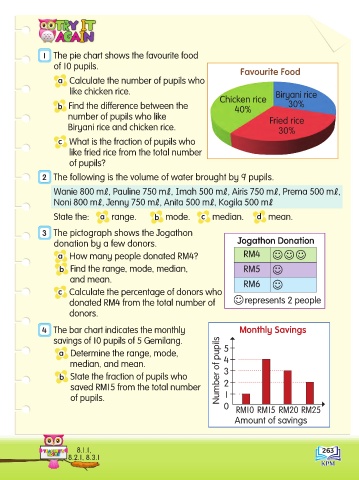
1  The pie chart shows the favourite food
                      of 10 pupils.
                                                                              Favourite Food
                       a   Calculate the number of pupils who
                           like chicken rice.                                            Biryani rice
                                                                        Chicken rice
                       b  Find the difference between the                   40%             30%
                          number of pupils who like                                    Fried rice
                          Biryani rice and chicken rice.                                 30%

                       c   What is the fraction of pupils who
                           like fried rice from the total number
                           of pupils?
                  2  The following is the volume of water brought by 9 pupils.

                                      ,
                       Wanie 800 m  Pauline 750 m , Imah 500 m , Airis 750 m , Prema 500 m ,
                      Noni 800 m  , Jenny 750 m , Anita 500 m , Kogila 500 m

                      State the:    a  range.       b  mode.    c  median.     d  mean.

                  3  The pictograph shows the Jogathon
                      donation by a few donors.                              Jogathon Donation
                       a   How many people donated RM4?                        RM4
                        b  Find the range, mode, median,                       RM5
                           and mean.
                                                                               RM6

                       c   Calculate the percentage of donors who
                           donated RM4 from the total number of                represents 2 people
                           donors.

                  4   The bar chart indicates the monthly                     Monthly Savings
                      savings of 10 pupils of 5 Gemilang.
                        a  Determine the range, mode,                    5
                           median, and mean.                            Number of pupils  4

                        b   State the fraction of pupils who             3
                           saved RM15 from the total number              2
                           of pupils.                                    1
                                                                         0
                                                                             RM10 RM15 RM20 RM25
                                                                            Amount of savings


                             8.1.1,                                                                    263
                          8.2.1, 8.3.1