Page 270 - SK Year 5 Mathematics DLP
P. 270

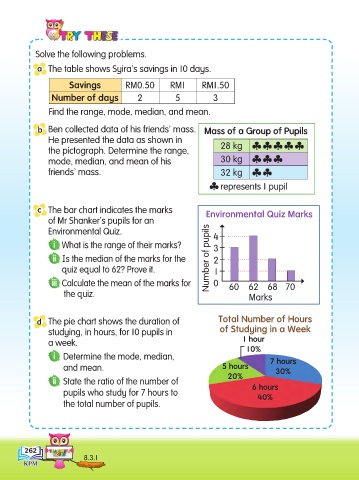
Solve the following problems.

                 a   The table shows Syira’s savings in 10 days.

                           Savings          RM0.50       RM1      RM1.50
                     Number of days            2          5           3

                    Find the range, mode, median, and mean.

                 b   Ben collected data of his friends’ mass.      Mass of a Group of Pupils
                    He presented the data as shown in
                    the pictograph. Determine the range,                28 kg
                    mode, median, and mean of his                       30 kg
                    friends’ mass.                                      32 kg

                                                                        represents 1 pupil


                 c   The bar chart indicates the marks              Environmental Quiz Marks
                    of Mr Shanker’s pupils for an
                    Environmental Quiz.                               4
                      i  What is the range of their marks?            3

                      ii   Is the median of the marks for the        Number of pupils  2
                        quiz equal to 62? Prove it.                   1
                     iii  Calculate the mean of the marks for         0    60   62 68 70
                         the quiz.                                               Marks


                 d   The pie chart shows the duration of               Total Number of Hours
                    studying, in hours, for 10 pupils in                of Studying in a Week
                    a week.                                                    1 hour
                                                                                10%
                      i   Determine the mode, median,                                  7 hours
                         and mean.                                      5 hours          30%
                                                                          20%
                      ii   State the ratio of the number of
                                                                                 6 hours
                         pupils who study for 7 hours to                           40%
                         the total number of pupils.


             262
                               8.3.1
   265   266   267   268   269   270   271   272   273   274   275