
Page 268 - SK Year 5 Mathematics DLP
P. 268
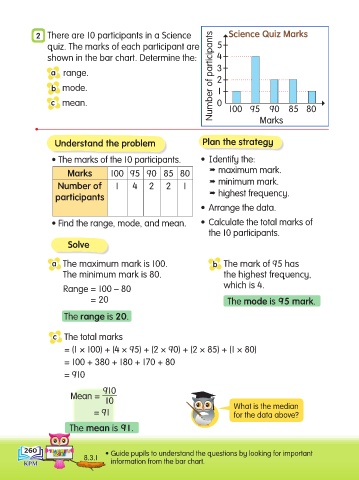
2 There are 10 participants in a Science Science Quiz Marks
quiz. The marks of each participant are 5
shown in the bar chart. Determine the: 4
a range. Number of participants 3
2
b mode. 1
c mean. 0 100 95 Marks
90 85 80
Understand the problem Plan the strategy
• The marks of the 10 participants. • Identify the:
Marks 100 95 90 85 80 maximum mark.
minimum mark.
Number of 1 4 2 2 1
participants highest frequency.
• Arrange the data.
• Find the range, mode, and mean. • Calculate the total marks of
the 10 participants.
Solve
a The maximum mark is 100. b The mark of 95 has
The minimum mark is 80. the highest frequency,
Range = 100 – 80 which is 4.
= 20 The mode is 95 mark.
The range is 20.
c The total marks
= (1 × 100) + (4 × 95) + (2 × 90) + (2 × 85) + (1 × 80)
= 100 + 380 + 180 + 170 + 80
= 910
910
Mean =
10
What is the median
= 91 for the data above?
The mean is 91.
260 • Guide pupils to understand the questions by looking for important
8.3.1
information from the bar chart.