
Page 28 - TCS ICT Book 7
P. 28
The City School 2021-2022
1.9. Conditional Formatting
Conditional formatting allows you to
automatically apply formatting—such as Checkpoint
colors, icons, and data bars—to one or
more cells based on the cell value. To do Column/bar chart is used to illustrate
comparisons between a series of data.
this, you’ll need to create a conditional Line chart shows the changes in data
over a period of time.
formatting rule. For example, a conditional
Pie chart shows the relationship of the
formatting rule might be: If the value is less parts to the whole.
than $2000, color the cell red. By applying
this rule, you’d be able to quickly see which cells contain values less
than $2000.
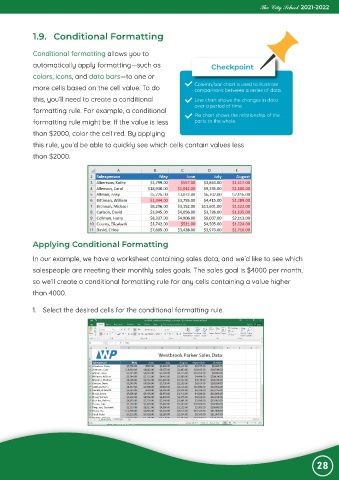
Applying Conditional Formatting
In our example, we have a worksheet containing sales data, and we’d like to see which
salespeople are meeting their monthly sales goals. The sales goal is $4000 per month,
so we’ll create a conditional formatting rule for any cells containing a value higher
than 4000.
1. Select the desired cells for the conditional formatting rule.
28