
Page 24 - TCS ICT Book 7
P. 24
The City School 2021-2022
5. To visualize data of a selected range of data, hold the ctrl key and select your
desired columns. For instance, in this example, we need to visualize fiction book
sales in the year 2010 only. Select the range A1:A6 hold down the ctrl key and select
the cell range D1:D6.
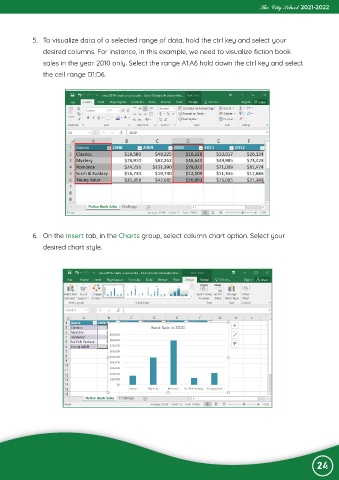
6. On the Insert tab, in the Charts group, select column chart option. Select your
desired chart style.
24