
Page 32 - TCS ICT Book 7
P. 32
The City School 2021-2022
1.11. Pivot Table
When you have a lot of data, it can sometimes be difficult to analyze all of the
information in your worksheet. PivotTables can help make your worksheets more
manageable by summarizing your data and allowing you to manipulate it in different
ways.
Using Pivot Tables to Answer Questions
Consider the example below. Let’s say we wanted to answer the question What is the
amount sold by each salesperson? Answering it could be time consuming and difficult;
each salesperson appears on multiple rows, and we would need to total all of their
different orders individually. We could use the Subtotal command to help find the total
for each salesperson, but we would still have a lot of data to work with.
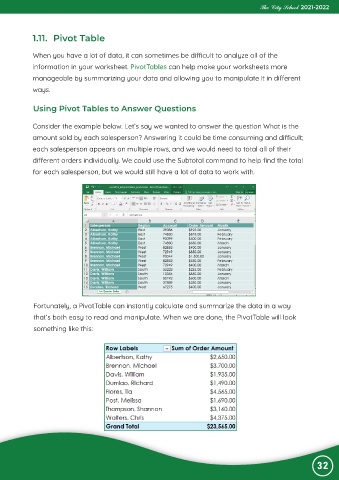
Fortunately, a PivotTable can instantly calculate and summarize the data in a way
that’s both easy to read and manipulate. When we are done, the PivotTable will look
something like this:
32