Page 62 - T-I JOURNAL19 4
P. 62

710                                DEMIRALP ET AL.                                                                                  WOMEN’S ENTREPRENEURSHIP IN STEM                        711
                                                                                                                 Table 1. Break-down of the Employed Population (2015 ACS)

                                                                                                                                                     Women
      juxtaposition of the two classifications for business  2012 SBO data is available only in aggregate form,   Table 1. Break-down of the Employed Population (2015 ACS)          Men
      owners: those who identify as self-employed based  which requires the analysis to be based on the stan-                                    Count Women    Percentage      Count  Men    Percentage
                                                                                                                                                               100%
                                                                                                                                                                                              100%
      on the job at which they work the highest number  dard majority ownership definition.                       Employed                  71,657,044      Percentage    79,936,236       Percentage
                                                                                                                                                 Count
                                                                                                                                                                                Count
      of hours, as identified through use of the ACS, and                                                         Wage/Salary Employment    66,456,749         92.7%      70,911,908          88.7%
                                                                                                                                                                                              100%
                                                                                                                                            71,657,044
                                                                                                                                                                          79,936,236
                                                                                                                                                               100%
      those that identify as primary business owners with  STEM ENTREPRENEURSHIP AMONG WOMEN                      Employed                   9,609,195         13.4%        8,538,726         10.7%
                                                                                                                    STEM
                                                                                                                    Non-STEM
      the highest stake in the firm, as identified through    An important first step in examining commercial-    Wage/Salary Employment    66,456,749         92.7%      70,911,908          88.7%
                                                                                                                                                                          62,373,182
                                                                                                                                                               79.3%
                                                                                                                                            56,847,554
                                                                                                                                                                                              78.0%
      use of the SBO.                             ization among women entrepreneurs is to understand                STEM                     9,609,195         13.4%        8,538,726         10.7%
                                                                                                                                                                7.3%
                                                                                                                  Self-Employment
                                                                                                                                                                            9,024,328
                                                                                                                                                                                              11.3%
                                                                                                                                             5,200,295
        This primary business ownership definition   women’s entrepreneurial decisions, particularly the            Non-STEM                56,847,554         79.3%      62,373,182          78.0%
                                                                                                                                                                               644,230
                                                                                                                                                                                               0.8%
                                                                                                                                              307,753
                                                                                                                                                                0.4%
                                                                                                                    STEM
      employed in the analysis of SBO data offers advan-  decision to become an entrepreneur. Using data from     Self-Employment            5,200,295          7.3%        9,024,328         11.3%
                                                                                                                                                4,892,542
                                                                                                                                                                              8,380,098
                                                                                                                                                                6.8%
                                                                                                                                                                                              10.5%
                                                                                                                    Non-STEM
      tages over using the standard ownership definition,  the 2015 ACS, this report analyzes women’s propen-       STEM                      307,753           0.4%           644,230         0.8%
      in which owners must hold a majority stake (51%  sity to become self-employed in STEM fields and how        Source: Authors’ analysis of 2015 American Community Survey obtained from the IPUMS-USA database.  10.5%
                                                                                                                                                4,892,542
                                                                                                                    Non-STEM
                                                                                                                                                                              8,380,098
                                                                                                                                                                6.8%

      share of ownership) in the firm. Using this alter-  it compares to 1) men’s prevalence in STEM self-em-     Note: STEM fields are defined based on occupation codes and include the following: Computer and Mathematical
                                                                                                                  Occupations, Architecture and Engineering Occupations, Life and Physical Sciences Occupations, Health

      native definition of primary ownership captures a  ployment and 2) women’s participation in STEM            Source: Authors’ analysis of 2015 American Community Survey obtained from the IPUMS-USA database.
                                                                                                                  Note: STEM fields are defined based on occupation codes and include the following: Computer and Mathematical
      greater population of business owners than the one  fields in wage/salary employment (13). This descrip-    Occupations.
      that would be captured under the stricter majority  tive analysis not only provides contextual information   Occupations, Architecture and Engineering Occupations, Life and Physical Sciences Occupations, Health
                                                                                                                  Occupations.
      stake ownership definition. It not only includes busi-  for examining women’s commercialization activities
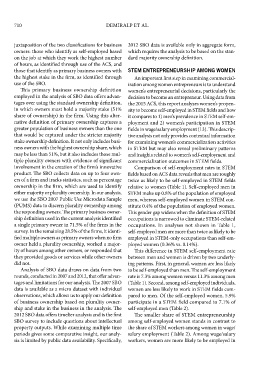
      ness owners with the highest ownership share, which  in STEM but may also reveal preliminary patterns      Table 2. Share of STEM in the Employed Population (2015 ACS)
      may be less than 51%, but it also includes those mul-  and insights related to women’s self-employment and

      tiple plurality owners with evidence of significant  commercialization outcomes in STEM fields.            Table 2. Share of STEM in the Employed Population (2015 ACS)  Women            Men

      involvement in the creation of the firm’s innovative    Comparison of self-employment rates in STEM         Self-Employed (Total Count)                   5,200,295                 9,024,328
                                                                                                                                                                                                Men
      product. The SBO collects data on up to four own-  fields based on ACS data reveals that men are roughly     STEM                                            Women                       7.1%
                                                                                                                                                                    5.9%
      ers of a firm and tracks statistics, such as percentage  twice as likely to be self-employed in STEM fields   Self-Employed (Total Count)                 5,200,295                 9,024,328
                                                                                                                                                                   94.1%
                                                                                                                                                                                              92.9%
                                                                                                                   Non-STEM
                                                                                                                                                                                               7.1%
                                                                                                                                                                    5.9%
                                                                                                                   STEM
      ownership in the firm, which are used to identify  relative to women (Table 1). Self-employed men in        Wage/Salary Workers (Total Count)            66,456,749                70,911,908
      either majority or plurality ownership. In our analysis,  STEM make up 0.8% of the population of employed    Non-STEM                                        94.1%                      92.9%
                                                                                                                                                                                              12.0%
                                                                                                                                                                   14.5%
                                                                                                                   STEM
      we use the SBO 2007 Public Use Microdata Sample  men, whereas self-employed women in STEM con-              Wage/Salary Workers (Total Count)            66,456,749                70,911,908
      (PUMS) data to discern plurality ownership among  stitute 0.4% of the population of employed women.          Non-STEM                                        85.5%                      88.0%
                                                                                                                                                                   14.5%
                                                                                                                                                                                              12.0%
                                                                                                                   STEM
      the responding owners. The primary business owner-  This gender gap widens when the definition of STEM      Source: Authors’ analysis of 2015 American Community Survey obtained from the IPUMS-USA database.  88.0%
                                                                                                                   Non-STEM
                                                                                                                                                                   85.5%
      ship definition used in the current analysis identified  occupations is narrowed to eliminate STEM-related   Note: STEM fields are defined based on occupation codes and include the following: Computer and Mathematical
                                                                                                                  Occupations, Architecture and Engineering Occupations, Life and Physical Sciences Occupations, Health
      a single primary owner in 71.5% of the firms in the  occupations. In analyses not shown in Table 1,         Source: Authors’ analysis of 2015 American Community Survey obtained from the IPUMS-USA database.
      survey. In the remaining 28.5% of the firms, it identi-  self-employed men are more than twice as likely to be   Occupations.
                                                                                                                  Note: STEM fields are defined based on occupation codes and include the following: Computer and Mathematical
      fied multiple owners as primary owners when no firm  employed in STEM-only occupations than self-em-        Occupations, Architecture and Engineering Occupations, Life and Physical Sciences Occupations, Health
                                                                                                                  Occupations.
      owner held a plurality ownership, worked a major-  ployed women (0.36% vs. 0.14%).                         a STEM field (14.5%) compared to men (12%). The    Distribution of entrepreneurship across STEM

      ity of hours among other owners, or responded that    This difference in STEM self-employment rate         observation that, relative to men, women in wage/sal-  occupations varies between men and women, sug-
                                                                                                                  Table 3. Distribution of STEM Entrepreneurship across STEM Fields (2015 ACS)
      they provided goods or services while other owners  between men and women is driven by two underly-        ary employment have greater participation in STEM  gesting that both internal motivations and external

      did not.                                    ing patterns. First, in general, women are less likely         and self-employed women have lower participation  forces may encourage women’s entrepreneurship to
                                                                                                                  Table 3. Distribution of STEM Entrepreneurship across STEM Fields (2015 ACS)

        Analysis of SBO data draws on data from two   to be self-employed than men. The self-employment          in STEM may be indicative of the barriers women in  a greater extent in certain STEM fields (Table 3).   Women    Men
      rounds, conducted in 2007 and 2012, that offer advan-  rate is 7.3% among women versus 11.3% among men     STEM face in entering self-employment. Specifically,  Women who choose to be self-employed in STEM


                                                                                                                                                                                                Men

                                                                                                                                                                               Women
                                                                                                                                                                              307,753
                                                                                                                                                                                            644,230
                                                                                                                  Self-employed in STEM (Total Count)


      tages and limitations for our analysis. The 2007 SBO  (Table 1). Second, among self-employed individuals,   women in STEM may face different challenges than  occupations work predominantly in health occupa-
                                                                                                                  Computer and Mathematical Occupations (e.g., computer
      data is available as a micro dataset with individual  women are less likely to work in STEM fields com-    those faced by women in non-STEM fields in enter-  tions (e.g., physicians, dentists, physical therapists,
                                                                                                                  Self-employed in STEM (Total Count)
                                                                                                                                                                              307,753
                                                                                                                                                                                            644,230


                                                                                                                                                                                              26.1%
                                                                                                                  programmers, web developers, operations research analysts)
                                                                                                                                                                                13.1%


      observations, which allows us to apply our definition  pared to men. Of the self-employed women, 5.9%      ing entrepreneurship, or their entrepreneurial  opticians) (77.8%). The distribution of the self-em-
                                                                                                                  Computer and Mathematical Occupations (e.g., computer
      of business ownership based on plurality owner-  participate in a STEM field compared to 7.1% of           decisions may be more sensitive to certain determi-  ployed women population across the remaining
                                                                                                                  programmers, web developers, operations research analysts)
                                                                                                                                                                                13.1%
                                                                                                                                                                                              26.1%


                                                                                                                                                                                              18.2%
                                                                                                                                                                                 6.7%


                                                                                                                  Architecture and Engineering Occupations
      ship and stake in the business in the analysis. The  self-employed men (Table 2).                          nants of entrepreneurship compared to women in  STEM occupations varies substantially, with 13.1%
                                                                                                                  Life and Physical Sciences Occupations (e.g., physical scientists,
      2012 SBO data offers timelier analysis and is the first    The smaller share of STEM entrepreneurship      other fields. Identifying the unique determinants of  in computer and mathematical occupations, 6.7% in
                                                                                                                                                                                 6.7%
                                                                                                                                                                                              18.2%

                                                                                                                  Architecture and Engineering Occupations


                                                                                                                                                                                               3.1%

                                                                                                                                                                                 2.4%
                                                                                                                  chemist and material scientists, biological scientists)
      SBO survey to include questions about intellectual  among self-employed women stands in contrast to        STEM entrepreneurship among women or factors  architecture and engineering, and 2.4% in life and
                                                                                                                  Life and Physical Sciences Occupations (e.g., physical scientists,
                                                                                                                  Health Occupations (e.g., physicians and surgeons, registered
      property outputs. While examining multiple time  the share of STEM workers among women in wage/            that disproportionately affect STEM entrepreneur-  physical sciences occupations.     3.1%
                                                                                                                                                                                 2.4%
                                                                                                                  chemist and material scientists, biological scientists)
                                                                                                                                                                                              52.6%
                                                                                                                                                                                77.8%
                                                                                                                  nurses, clinical laboratory technologists and technicians)


      periods gives some comparative insight, our analy-  salary employment (Table 2). Among wage/salary         ship is an important research goal that would provide    While these general patterns hold for self-em-
                                                                                                                  Health Occupations (e.g., physicians and surgeons, registered
      sis is limited by public data availability. Specifically,  workers, women are more likely to be employed in   key insights for policy-making.         ployed men in STEM fields, there are differences in
                                                                                                                  nurses, clinical laboratory technologists and technicians)    77.8%         52.6%
                                                                                                                                                                                100%
                                                                                                                  TOTAL %
                                                                                                                                                                                               100%

                                                                                                                  Source: Authors’ analysis of 2015 American Community Survey obtained from the IPUMS-USA database.
                                                                                                                  TOTAL %                                                       100%           100%
                                                                                                                  Note: STEM fields are defined based on occupation codes and include the following: Computer and Mathematical
                                                                                                                  Source: Authors’ analysis of 2015 American Community Survey obtained from the IPUMS-USA database.
                                                                                                                  Occupations, Architecture and Engineering Occupations, Life and Physical Sciences Occupations, Health
                                                                                                                  Occupations.
                                                                                                                  Note: STEM fields are defined based on occupation codes and include the following: Computer and Mathematical
                                                                                                                  Occupations, Architecture and Engineering Occupations, Life and Physical Sciences Occupations, Health
                                                                                                                  Occupations.
   57   58   59   60   61   62   63   64   65   66   67