
Page 63 - T-I JOURNAL19 4
P. 63
WOMEN’S ENTREPRENEURSHIP IN STEM 711
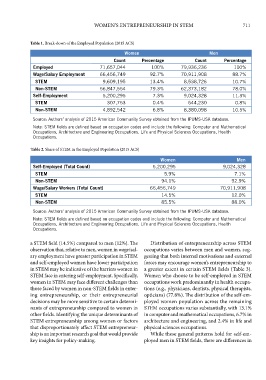
Table 1. Break-down of the Employed Population (2015 ACS)
Women
Table 1. Break-down of the Employed Population (2015 ACS) Men
Count Percentage Count Percentage
Women Men
Employed 71,657,044 100% 79,936,236 100%
Count
Count
92.7%
88.7%
Wage/Salary Employment 66,456,749 Percentage 70,911,908 Percentage
Employed 71,657,044 100% 79,936,236 100%
STEM 9,609,195 13.4% 8,538,726 10.7%
Wage/Salary Employment 66,456,749 92.7% 70,911,908 88.7%
Non-STEM 56,847,554 79.3% 62,373,182 78.0%
STEM 9,609,195 13.4% 8,538,726 10.7%
Self-Employment 5,200,295 7.3% 9,024,328 11.3%
Non-STEM 56,847,554 79.3% 62,373,182 78.0%
STEM 307,753 0.4% 644,230 0.8%
Self-Employment 5,200,295 7.3% 9,024,328 11.3%
Non-STEM 4,892,542 6.8% 8,380,098 10.5%
STEM 307,753 0.4% 644,230 0.8%
Source: Authors’ analysis of 2015 American Community Survey obtained from the IPUMS-USA database.
Non-STEM 4,892,542 6.8% 8,380,098 10.5%
Note: STEM fields are defined based on occupation codes and include the following: Computer and Mathematical
Source: Authors’ analysis of 2015 American Community Survey obtained from the IPUMS-USA database.
Occupations, Architecture and Engineering Occupations, Life and Physical Sciences Occupations, Health
Occupations.
Note: STEM fields are defined based on occupation codes and include the following: Computer and Mathematical
Occupations, Architecture and Engineering Occupations, Life and Physical Sciences Occupations, Health
Occupations.
Table 2. Share of STEM in the Employed Population (2015 ACS)
Table 2. Share of STEM in the Employed Population (2015 ACS) Women Men
Self-Employed (Total Count) 5,200,295 9,024,328
Women Men
STEM 5.9% 7.1%
Self-Employed (Total Count) 5,200,295 9,024,328
Non-STEM 94.1% 92.9%
STEM 5.9% 7.1%
Wage/Salary Workers (Total Count) 66,456,749 70,911,908
Non-STEM 94.1% 92.9%
STEM 14.5% 12.0%
Wage/Salary Workers (Total Count) 66,456,749 70,911,908
Non-STEM 85.5% 88.0%
STEM 14.5% 12.0%
Source: Authors’ analysis of 2015 American Community Survey obtained from the IPUMS-USA database. 88.0%
Non-STEM
85.5%
Note: STEM fields are defined based on occupation codes and include the following: Computer and Mathematical
Source: Authors’ analysis of 2015 American Community Survey obtained from the IPUMS-USA database.
Occupations, Architecture and Engineering Occupations, Life and Physical Sciences Occupations, Health
Occupations.
Note: STEM fields are defined based on occupation codes and include the following: Computer and Mathematical
Occupations, Architecture and Engineering Occupations, Life and Physical Sciences Occupations, Health
Occupations.
a STEM field (14.5%) compared to men (12%). The Distribution of entrepreneurship across STEM
observation that, relative to men, women in wage/sal- occupations varies between men and women, sug-
Table 3. Distribution of STEM Entrepreneurship across STEM Fields (2015 ACS)
ary employment have greater participation in STEM gesting that both internal motivations and external
and self-employed women have lower participation forces may encourage women’s entrepreneurship to
Table 3. Distribution of STEM Entrepreneurship across STEM Fields (2015 ACS)
in STEM may be indicative of the barriers women in a greater extent in certain STEM fields (Table 3). Women Men
STEM face in entering self-employment. Specifically, Women who choose to be self-employed in STEM
Men
Women
Self-employed in STEM (Total Count)
307,753
644,230
women in STEM may face different challenges than occupations work predominantly in health occupa-
Computer and Mathematical Occupations (e.g., computer
those faced by women in non-STEM fields in enter- tions (e.g., physicians, dentists, physical therapists,
307,753
644,230
Self-employed in STEM (Total Count)
programmers, web developers, operations research analysts)
26.1%
13.1%
ing entrepreneurship, or their entrepreneurial opticians) (77.8%). The distribution of the self-em-
Computer and Mathematical Occupations (e.g., computer
decisions may be more sensitive to certain determi- ployed women population across the remaining
programmers, web developers, operations research analysts)
26.1%
13.1%
6.7%
18.2%
Architecture and Engineering Occupations
nants of entrepreneurship compared to women in STEM occupations varies substantially, with 13.1%
other fields. Identifying the unique determinants of in computer and mathematical occupations, 6.7% in
Life and Physical Sciences Occupations (e.g., physical scientists,
6.7%
18.2%
Architecture and Engineering Occupations
3.1%
chemist and material scientists, biological scientists)
2.4%
STEM entrepreneurship among women or factors architecture and engineering, and 2.4% in life and
Life and Physical Sciences Occupations (e.g., physical scientists,
Health Occupations (e.g., physicians and surgeons, registered
that disproportionately affect STEM entrepreneur- physical sciences occupations.
chemist and material scientists, biological scientists)
2.4%
3.1%
52.6%
77.8%
nurses, clinical laboratory technologists and technicians)
ship is an important research goal that would provide While these general patterns hold for self-em-
Health Occupations (e.g., physicians and surgeons, registered
key insights for policy-making. ployed men in STEM fields, there are differences in
nurses, clinical laboratory technologists and technicians) 77.8% 52.6%
TOTAL %
100%
100%
Source: Authors’ analysis of 2015 American Community Survey obtained from the IPUMS-USA database.
TOTAL % 100% 100%
Note: STEM fields are defined based on occupation codes and include the following: Computer and Mathematical
Source: Authors’ analysis of 2015 American Community Survey obtained from the IPUMS-USA database.
Occupations, Architecture and Engineering Occupations, Life and Physical Sciences Occupations, Health
Occupations.
Note: STEM fields are defined based on occupation codes and include the following: Computer and Mathematical
Occupations, Architecture and Engineering Occupations, Life and Physical Sciences Occupations, Health
Occupations.