
Page 64 - T-I JOURNAL19 4
P. 64
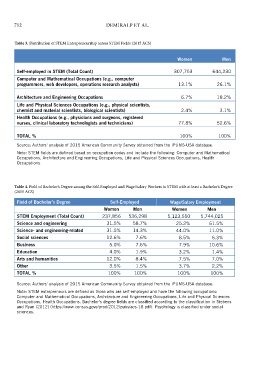
Table 1. Break-down of the Employed Population (2015 ACS)
Women
Men
Percentage
Count
Percentage
Count
79,936,236
71,657,044
100%
100%
Employed
88.7%
70,911,908
92.7%
66,456,749
Wage/Salary Employment
8,538,726
9,609,195
13.4%
10.7%
STEM
56,847,554
79.3%
Non-STEM
78.0%
62,373,182
7.3%
5,200,295
9,024,328
11.3%
Self-Employment
0.4%
307,753
0.8%
644,230
STEM
10.5%
4,892,542
6.8%
8,380,098
Non-STEM
Source: Authors’ analysis of 2015 American Community Survey obtained from the IPUMS-USA database.
Note: STEM fields are defined based on occupation codes and include the following: Computer and Mathematical
Occupations, Architecture and Engineering Occupations, Life and Physical Sciences Occupations, Health
Occupations.
Table 2. Share of STEM in the Employed Population (2015 ACS)
Men
Women
Self-Employed (Total Count)
5,200,295
9,024,328
7.1%
5.9%
STEM
94.1%
Non-STEM
70,911,908
66,456,749
Wage/Salary Workers (Total Count)
12.0%
14.5%
STEM
88.0%
85.5%
Non-STEM
Source: Authors’ analysis of 2015 American Community Survey obtained from the IPUMS-USA database. 92.9%
Note: STEM fields are defined based on occupation codes and include the following: Computer and Mathematical
Occupations, Architecture and Engineering Occupations, Life and Physical Sciences Occupations, Health
Occupations.
712 DEMIRALP ET AL. WOMEN’S ENTREPRENEURSHIP IN STEM 713
Table 3. Distribution of STEM Entrepreneurship across STEM Fields (2015 ACS) the distribution across fields. Self-employed men in in terms of their undergraduate fields is more pro-
STEM are almost twice as likely to be in computer/ nounced among the self-employed in STEM.
Women Men mathematical occupations and almost three times as The lower prevalence of undergraduate STEM
likely to be in architecture/engineering occupations education among self-employed women in STEM
Self-employed in STEM (Total Count) 307,753 644,230 relative to self-employed women in STEM. On the relative to men may reflect different pathways that
Computer and Mathematical Occupations (e.g., computer other hand, they have a smaller representation in women may take into STEM entrepreneurship. For
programmers, web developers, operations research analysts) 13.1% 26.1% health occupations (52.6%) relative to women who example, self-employed women in STEM who study
are self-employed in STEM fields (77.8%). a non-STEM-related field in college may be more
Architecture and Engineering Occupations 6.7% 18.2% likely than men to receive graduate degrees in STEM
Life and Physical Sciences Occupations (e.g., physical scientists, THE ROLE OF STEM EDUCATION AND fields. Among examples of moving from a non-STEM
chemist and material scientists, biological scientists) 2.4% 3.1% TRAINING undergraduate field to a STEM graduate field are indi-
Health Occupations (e.g., physicians and surgeons, registered Central to understanding the gender dynamics of viduals who earn undergraduate degrees in literature
nurses, clinical laboratory technologists and technicians) 77.8% 52.6% entrepreneurship and commercialization in STEM or history who go on to medical school or earn other
fields are factors motivating participation, including graduate degrees in health care. Alternatively, women
TOTAL % 100% 100% STEM education and training. To better understand who do not receive a formal education in STEM
the relationship between STEM education and STEM may be more likely than men to build their STEM
Source: Authors’ analysis of 2015 American Community Survey obtained from the IPUMS-USA database.
entrepreneurship, this report presents an examination expertise through informal or on-the-job training
Note: STEM fields are defined based on occupation codes and include the following: Computer and Mathematical of fields that people employed in STEM occupa- prior to starting their businesses. Our finding of
Occupations, Architecture and Engineering Occupations, Life and Physical Sciences Occupations, Health tions studied during undergraduate education. The lower prevalence of undergraduate STEM educa-
Occupations.
undergraduate degree fields are classified into the tion among self-employed women in STEM relative
following seven groups based on Siebens and Ryan to men suggests that these alternative paths may be
(2012): science and engineering, science- and engi- more prevalent for female entrepreneurs relative to
Table 4. Field of Bachelor’s Degree among the Self-Employed and Wage/Salary Workers in STEM with at least a Bachelor’s Degree neering-related, social sciences, business, education, male entrepreneurs. Further empirical research is
(2015 ACS) arts/humanities, and other. Science and engineer- needed to determine the extent to which these alter-
Field of Bachelor’s Degree Self-Employed Wage/Salary Employment ing fields include computer science; computer and native explanations hold.
Second, self-employed women in STEM are less
Women Men Women Men information systems; mathematics and statistics; bio-
logical, agricultural, and environmental sciences; likely to have a science, engineering, or related degree
STEM Employment (Total Count) 237,856 536,298 5,123,550 5,744,025 physical and related sciences; social sciences; and compared to women STEM wage/salary workers
Science and engineering 31.5% 58.7% 25.2% 61.5% engineering (14). Science- and engineering-related (63% vs. 69.2%). This finding underscores the relative
Science- and engineering-related 31.5% 14.3% 44.0% 11.0% fields include, for example, nursing, architecture, and importance of graduate degrees or informal STEM
Social sciences 12.6% 7.6% 8.5% 6.3% mathematics teacher education. training among self-employed women compared to
Business 5.0% 7.6% 7.9% 10.6% The analysis findings reveal several key features of women in wage/salary employment. Furthermore,
Education 4.0% 1.9% 3.2% 1.4% the relationship between STEM education and STEM compared to self-employed women in STEM, women
Arts and humanities 12.0% 8.4% 7.5% 7.0% entrepreneurship. First, the majority of self-employed working in STEM wage/salary employment have
Other 3.5% 1.5% 3.7% 2.2% men and women in STEM with at least a bachelor’s a lower frequency of receiving a science and engi-
TOTAL % 100% 100% 100% 100% degree have received a bachelor’s degree in science, neering degree and a higher frequency of receiving
engineering, or related fields (Table 4). However, rel- a science- and engineering-related degree.
Source: Authors’ analysis of 2015 American Community Survey obtained from the IPUMS-USA database. ative to men, self-employed women in STEM are less A review of the literature reveals that, in general,
likely to have received a bachelor’s degree in science, women are underrepresented among students pur-
Note: STEM entrepreneurs are defined as those who are self-employed and have the following occupations:
Computer and Mathematical Occupations, Architecture and Engineering Occupations, Life and Physical Sciences engineering, or related fields in their undergraduate suing STEM educations. This gender-based gap has
Occupations, Health Occupations. Bachelor’s degree fields are classified according to the classification in Siebens education (31.5% + 31.5% = 63% vs. 58.7% + 14.3% been identified consistently in primary and second-
and Ryan (2012) (https://www.census.gove/prod/2012/pubs/acs-18.pdf). Psychology is classified under social = 73%). Therefore, a larger share of self-employed ary education and documented by programs targeting
sciences.
women in STEM, relative to similar men, consists of girls’ K-12 involvement (2). However, this gap is most
individuals with undergraduate degrees that are not often identified at the undergraduate level, where
related to science or engineering. A similar pattern data on majors and course selection is collected more
is also evident among wage/salary workers in STEM; systematically and students pursue distinct degrees
however, the difference between men and women by subject (15). Furthermore, women who pursue
Table 5. Educational Attainment of the Self-Employed
in STEM Fields, by Gender (2015 ACS)
Women Men
307,753 644,230
Education (%)
High School or Less 5.2% 3.9%
Some College 9.3% 8.4%
Associate’s Degree 8.3% 4.4%
Bachelor’s Degree 20.3% 24.4%
Master’s Degree 18.7% 11.6%
Professional Degree 28.3% 35.8%
Doctorate Degree 10.0% 11.4%
Source: Authors’ analysis of 2015 American
Community Survey obtained from the IPUMS-USA
database.
Note: STEM fields are defined based on occupation
codes and include the following: Computer and
Mathematical Occupations, Architecture and
Engineering Occupations, Life and Physical Sciences
Occupations, Health Occcupations.