
Page 47 - Technology and Innovation Journal - 19-1
P. 47
DARTMOUTH PHD INNOVATION PROGRAM 385
average number of patents filed per student by In Figure 2, pie charts illustrate where our regular
students over the life of the program is about twice Ph.D. program and PhD Innovation Program stu-
that of the regular Ph.D. program students, and, dents go after graduation. To minimize the number
similarly, the percentage of program students who of categories, we grouped students into one of five
have filed at least one patent is also about twice categories: 1) Postdoctoral and medical programs, 2)
that of the regular program students. The involve- Entrepreneurial activity, which includes co-founded
ment of program students in start-ups during or start-ups, other start-ups, and venture fund advisers,
after graduation is substantially greater than reg- 3) Industry and/or Government non-entrepreneur-
ular program students. This is likely due in part ial positions, 4) Academic teaching positions, and
to heightened awareness and training as well as 5) Other. As can be readily observed, there is sub-
self-selection of students entering the program. stantial difference in outcomes between the regular
We acknowledge that, due to the small size of the Ph.D. program students and the PhD Innovation
PhD Innovation Program, one cannot draw strong Program students. Likely most of this may be ascribed
conclusions, but we feel it is still useful to report to self-selection of the students in the PhD Innovation
the data. Program, but outcomes show the program is meet-
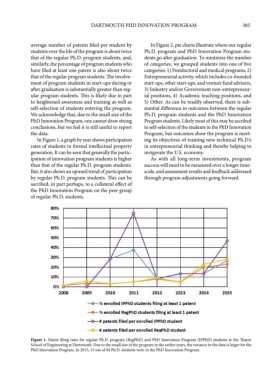
In Figure 1, a graph by year shows participation ing its objectives of training new technical Ph.D.’s
rates of students in formal intellectual property in entrepreneurial thinking and thereby helping to
generation. It can be seen that generally the partic- invigorate the U.S. economy.
ipation of innovation program students is higher As with all long-term investments, program
than that of the regular Ph.D. program students. success will need to be measured over a longer time-
But, it also shows an upward trend of participation scale, and assessment results and feedback addressed
by regular Ph.D. program students. This can be through program adjustments going forward.
ascribed, in part perhaps, to a collateral effect of
the PhD Innovation Program on the peer group
of regular Ph.D. students.
Figure 1. Patent filing rates for regular Ph.D. program (RegPhD) and PhD Innovation Program (IPPhD) students at the Thayer
School of Engineering at Dartmouth. Due to the small size of the program in the earlier years, the variance in the data is larger for the
PhD Innovation Program. In 2015, 15 out of 94 Ph.D. students were in the PhD Innovation Program.