
Page 134 - MARSIUM'21 COMP OF PAPER
P. 134
CHAI JING MIN (2022)
The age destribution of the
Figure 4.2. The age distribution of the respondents
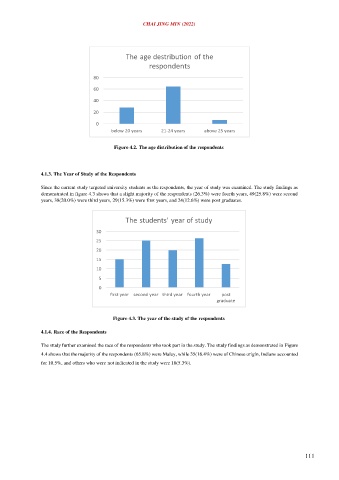
4.1.3. The Year of Study of the Respondents
Since the current study targeted university students as the respondents, the year of study was examined. The study findings as
demonstrated in figure 4.3 shows that a slight majority of the respondents (26.3%) were fourth years, 49(25.8%) were second
years, 38(20.0%) were third years, 29(15.3%) were first years, and 24(12.6%) were post graduates.
The students' year of study
Figure 4.3. The year of the study of the respondents
4.1.4. Race of the Respondents
The study further examined the race of the respondents who took part in the study. The study findings as demonstrated in Figure
4.4 shows that the majority of the respondents (65.8%) were Malay, while 35(18.4%) were of Chinese origin, Indians accounted
for 10.5%, and others who were not indicated in the study were 10(5.3%).
111