
Page 139 - MARSIUM'21 COMP OF PAPER
P. 139
CHAI JING MIN (2022)
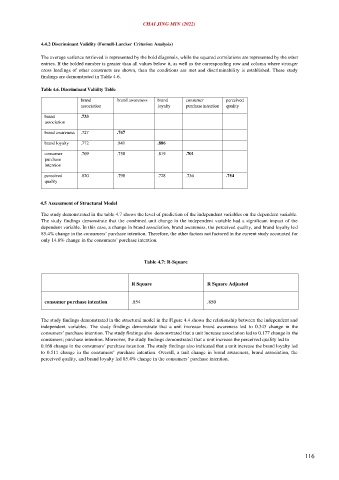
4.4.2 Discriminant Validity (Fornell-Larcker Criterion Analysis)
The average variance retrieved is represented by the bold diagonals, while the squared correlations are represented by the other
entries. If the bolded number is greater than all values below it, as well as the corresponding row and column where stronger
cross loadings of other constructs are shown, then the conditions are met and discriminability is established. These study
findings are demonstrated in Table 4.6.
Table 4.6. Discriminant Validity Table
brand brand awareness brand consumer perceived
association loyalty purchase intention quality
brand .733
association
brand awareness .727 .747
brand loyalty .772 .841 .886
consumer .769 .758 .819 .701
purchase
intention
perceived .820 .798 .728 .736 .754
quality
4.5 Assessment of Structural Model
The study demonstrated in the table 4.7 shows the level of prediction of the independent variables on the dependent variable.
The study findings demonstrate that the combined unit change in the independent variable had a significant impact of the
dependent variable. In this case, a change in brand association, brand awareness, the perceived quality, and brand loyalty led
85.4% change in the consumers’ purchase intention. Therefore, the other factors not factored in the current study accounted for
only 14.6% change in the consumers’ purchase intention.
Table 4.7: R-Square
R Square R Square Adjusted
consumer purchase intention .854 .850
The study findings demonstrated in the structural model in the Figure 4.4 shows the relationship between the independent and
independent variables. The study findings demonstrate that a unit increase brand awareness led to 0.345 change in the
consumers’ purchase intention. The study findings also demonstrated that a unit increase association led to 0.177 change in the
consumers; purchase intention. Moreover, the study findings demonstrated that a unit increase the perceived quality led to
0.168 change in the consumers’ purchase intention. The study findings also indicated that a unit increase the brand loyalty led
to 0.511 change in the consumers’ purchase intention. Overall, a unit change in brand awareness, brand association, the
perceived quality, and brand loyalty led 85.4% change in the consumers’ purchase intention.
116