
Page 135 - MARSIUM'21 COMP OF PAPER
P. 135
CHAI JING MIN (2022)
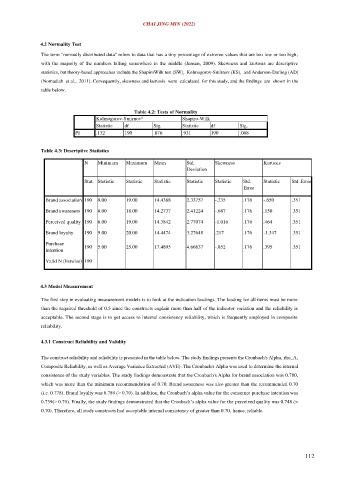
4.2 Normality Test
The term "normally distributed data" refers to data that has a tiny percentage of extreme values that are too low or too high,
with the majority of the numbers falling somewhere in the middle (Jensen, 2009). Skewness and kurtosis are descriptive
statistics, but theory-based approaches include the ShapiroWilk test (SW), Kolmogorov-Smirnov (KS), and Anderson-Darling (AD)
(Nornadiah et al., 2011). Consequently, skewness and kurtosis were calculated for this study, and the findings are shown in the
table below.
Table 4.2: Tests of Normality
a
Kolmogorov-Smirnov Shapiro-Wilk
Statistic df Sig. Statistic df Sig.
PI .132 190 .076 .931 190 .068
Table 4.3: Descriptive Statistics
N Minimum Maximum Mean Std. Skewness Kurtosis
Deviation
Stat. Statistic Statistic Statistic Statistic Statistic Std. Statistic Std. Error
Error
Brand association 190 9.00 19.00 14.4368 2.33757 -.235 .176 -.650 .351
Brand awareness 190 8.00 18.00 14.2737 2.41224 -.687 .176 .150 .351
Perceived quality 190 6.00 19.00 14.3842 2.77074 -1.016 .176 .464 .351
Brand loyalty 190 9.00 20.00 14.4474 3.27648 .217 .176 -1.347 .351
Purchase 190 5.00 25.00 17.4895 4.66637 -.852 .176 .395 .351
intention
Valid N (listwise) 190
4.3 Model Measurement
The first step in evaluating measurement models is to look at the indication loadings. The loading for all items must be more
than the required threshold of 0.5 since the constructs explain more than half of the indicator variation and the reliability is
acceptable. The second stage is to get access to internal consistency reliability, which is frequently employed in composite
reliability.
4.3.1 Construct Reliability and Validity
The construct reliability and reliability is presented in the table below. The study findings presents the Cronbach's Alpha, rho_A,
Composite Reliability, as well as Average Variance Extracted (AVE). The Cronbach's Alpha was used to determine the internal
consistence of the study variables. The study findings demonstrate that the Cronbach's Alpha for brand association was 0.780,
which was more than the minimum recommendation of 0.70. Brand awareness was also greater than the recommended 0.70
(i.e. 0.778). Brand loyalty was 0.789 (> 0.70). In addition, the Cronbach’s alpha value for the consumer purchase intention was
0.739(> 0.70). Finally, the study findings demonstrated that the Cronbach’s alpha value for the perceived quality was 0.748 (>
0.70). Therefore, all study constructs had acceptable internal consistency of greater than 0.70, hence, reliable.
112