
Page 302 - MARSIUM'21 COMP OF PAPER
P. 302
281 Chen (2021)
The table 6.0 above shows the multiple regression result output from SPSS statistics software. As we can see
that the significant value (p-value) is .000 (p < 0.05 ) thus hypothesis 2 is accepted.
H3 : Does religious values in Petronas CNY advertisement changes the audience perception towards interethnic
relation ?
The variables involved in this hypothesis is the religious values in Petronas CNY advertisement and the
perception towards interethnic relation. The data of degree of agreement from the three questions that respondents
feels about the religious values in the Petronas CNY advertisement. In Malaysia, the religious values of each ethnics
is different and absolute but they all share one similarity which is advocate kind hearted to anything you encounter in
life no matter its bad or good. Therefore, we want to test whether the religious value presented in Petronas CNY
advertisement will affect audience perception towards interethnic relation.
a
ANOVA
Sum of Mean
Model Squares df Square F Sig.
b
1 Regression 4.410 3 1.470 11.344 .000
Residual 13.216 102 0.130
Total 17.626 105
a. Dependent Variable: IMP_AVG
b. Predictors: (Constant), SOC3, SOC2, SOC1
Table 7.0
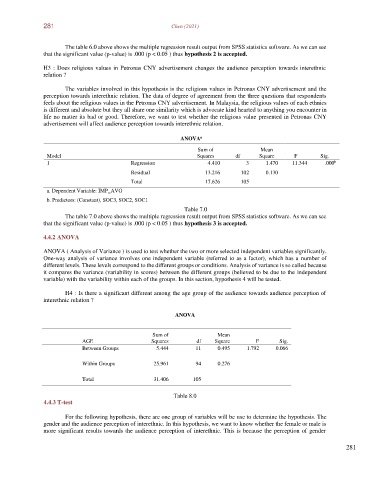
The table 7.0 above shows the multiple regression result output from SPSS statistics software. As we can see
that the significant value (p-value) is .000 (p < 0.05 ) thus hypothesis 3 is accepted.
4.4.2 ANOVA
ANOVA ( Analysis of Variance ) is used to test whether the two or more selected independent variables significantly.
One-way analysis of variance involves one independent variable (referred to as a factor), which has a number of
different levels. These levels correspond to the different groups or conditions. Analysis of variance is so called because
it compares the variance (variability in scores) between the different groups (believed to be due to the independent
variable) with the variability within each of the groups. In this section, hypothesis 4 will be tested.
H4 : Is there a significant different among the age group of the audience towards audience perception of
interethnic relation ?
ANOVA
Sum of Mean
AGE Squares df Square F Sig.
Between Groups 5.444 11 0.495 1.792 0.066
Within Groups 25.961 94 0.276
Total 31.406 105
Table 8.0
4.4.3 T-test
For the following hypothesis, there are one group of variables will be use to determine the hypothesis. The
gender and the audience perception of interethnic. In this hypothesis, we want to know whether the female or male is
more significant results towards the audience perception of interethnic. This is because the perception of gender
281