
Page 298 - MARSIUM'21 COMP OF PAPER
P. 298
277 Chen (2021)
4.0 DATA ANALYSIS PLAN
4.1 Demographic details of respondents
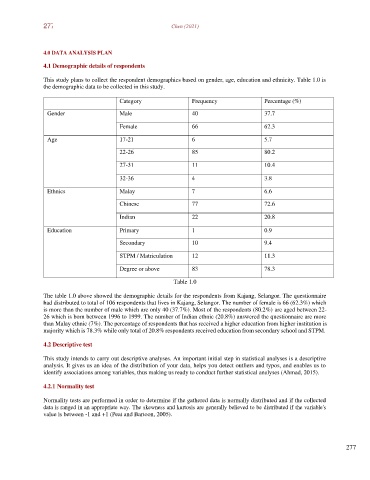
This study plans to collect the respondent demographics based on gender, age, education and ethnicity. Table 1.0 is
the demographic data to be collected in this study.
Category Frequency Percentage (%)
Gender Male 40 37.7
Female 66 62.3
Age 17-21 6 5.7
22-26 85 80.2
27-31 11 10.4
32-36 4 3.8
Ethnics Malay 7 6.6
Chinese 77 72.6
Indian 22 20.8
Education Primary 1 0.9
Secondary 10 9.4
STPM / Matriculation 12 11.3
Degree or above 83 78.3
Table 1.0
The table 1.0 above showed the demographic details for the respondents from Kajang, Selangor. The questionnaire
had distributed to total of 106 respondents that lives in Kajang, Selangor. The number of female is 66 (62.3%) which
is more than the number of male which are only 40 (37.7%). Most of the respondents (80.2%) are aged between 22-
26 which is born between 1996 to 1999. The number of Indian ethnic (20.8%) answered the questionnaire are more
than Malay ethnic (7%). The percentage of respondents that has received a higher education from higher institution is
majority which is 78.3% while only total of 20.8% respondents received education from secondary school and STPM.
4.2 Descriptive test
This study intends to carry out descriptive analyses. An important initial step in statistical analyses is a descriptive
analysis. It gives us an idea of the distribution of your data, helps you detect outliers and typos, and enables us to
identify associations among variables, thus making us ready to conduct further statistical analyses (Ahmad, 2015).
4.2.1 Normality test
Normality tests are performed in order to determine if the gathered data is normally distributed and if the collected
data is ranged in an appropriate way. The skewness and kurtosis are generally believed to be distributed if the variable's
value is between -1 and +1 (Peat and Bartoon, 2005).
277