
Page 299 - MARSIUM'21 COMP OF PAPER
P. 299
278 Chen (2021)
AES1 AES2 AES3 SOC1 SOC2 SOC3 REG1 REG2 REG3
N 106 106 106 106 106 106 106 106 106
Std. Deviation 0.481 0.518 0.620 0.591 0.578 0.618 0.708 0.620 0.651
Skewness -1.134 -0.683 -0.675 -0.634 -1.041 -0.362 -0.153 -0.675 0.177
Std. Error of 0.235 0.235 0.235 0.235 0.235 0.235 0.235 0.235 0.235
Skewness
Kurtosis -0.073 0.520 0.675 0.525 0.940 -0.435 -0.118 0.675 -0.168
Std. Error of 0.465 0.465 0.465 0.465 0.465 0.465 0.465 0.465 0.465
Kurtosis
IMP1 IMP2 IMP3 IMP4 IMP5 IMP6
N 106 106 106 106 106 106
Std. 0.602 0.540 0.628 0.646 0.633 0.638
Deviation
Skewness 0.259 0.111 0.083 0.189 -0.265 -0.378
Std. Error of 0.235 0.235 0.235 0.235 0.235 0.235
Skewness
Kurtosis -0.232 -0.384 -0.122 -0.003 -0.630 -0.668
Std. Error of 0.465 0.465 0.465 0.465 0.465 0.465
Kurtosis
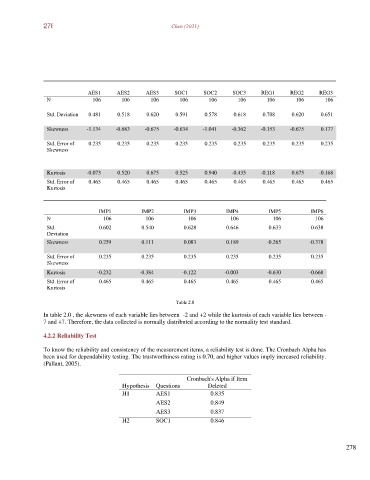
Table 2.0
In table 2.0 , the skewness of each variable lies between -2 and +2 while the kurtosis of each variable lies between -
7 and +7. Therefore, the data collected is normally distributed according to the normality test standard.
4.2.2 Reliability Test
To know the reliability and consistency of the measurement items, a reliability test is done. The Cronbach Alpha has
been used for dependability testing. The trustworthiness rating is 0.70, and higher values imply increased reliability.
(Pallant, 2005).
Cronbach's Alpha if Item
Hypothesis Questions Deleted
H1 AES1 0.835
AES2 0.849
AES3 0.837
H2 SOC1 0.846
278