
Page 301 - MARSIUM'21 COMP OF PAPER
P. 301
280 Chen (2021)
The connection between the dependent variable and the independent factors is indicated by the multiple
regression. This study conducted a multiple regression analysis to find out the strongest predictor for consumer intent,
to study the beta coefficient and the greatest value was the most influential variable in this group, according to Julie
Pallant. the analysis of the reverse effect was carried out. Multiple regression is not just one technique but a family of
techniques that can be used to explore the relationship between one continuous dependent variable and a number of
independent variables or predictors (Pallant,2010) The connection between the dependent variable and the independent
factors is indicated by the multiple regression. This study conducted a multiple regression analysis to find out the
strongest predictor for consumer intent, to study the beta coefficient and the greatest value was the most influential
variable in this group, according to Julie Pallant. the analysis of the reverse effect was carried out.
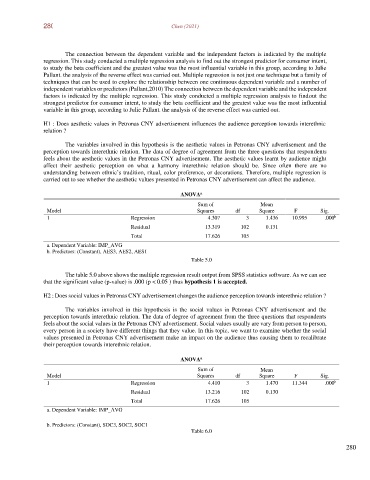
H1 : Does aesthetic values in Petronas CNY advertisement influences the audience perception towards interethnic
relation ?
The variables involved in this hypothesis is the aesthetic values in Petronas CNY advertisement and the
perception towards interethnic relation. The data of degree of agreement from the three questions that respondents
feels about the aesthetic values in the Petronas CNY advertisement. The aesthetic values learnt by audience might
affect their aesthetic perception on what a harmony interethnic relation should be. Since often there are no
understanding between ethnic’s tradition, ritual, color preference, or decorations. Therefore, multiple regression is
carried out to see whether the aesthetic values presented in Petronas CNY advertisement can affect the audience.
a
ANOVA
Sum of Mean
Model Squares df Square F Sig.
1 Regression 4.307 3 1.436 10.995 .000
b
Residual 13.319 102 0.131
Total 17.626 105
a. Dependent Variable: IMP_AVG
b. Predictors: (Constant), AES3, AES2, AES1
Table 5.0
The table 5.0 above shows the multiple regression result output from SPSS statistics software. As we can see
that the significant value (p-value) is .000 (p < 0.05 ) thus hypothesis 1 is accepted.
H2 : Does social values in Petronas CNY advertisement changes the audience perception towards interethnic relation ?
The variables involved in this hypothesis is the social values in Petronas CNY advertisement and the
perception towards interethnic relation. The data of degree of agreement from the three questions that respondents
feels about the social values in the Petronas CNY advertisement. Social values usually are vary from person to person,
every person in a society have different things that they value. In this topic, we want to examine whether the social
values presented in Petronas CNY advertisement make an impact on the audience thus causing them to recalibrate
their perception towards interethnic relation.
ANOVA
a
Sum of Mean
Model Squares df Square F Sig.
b
1 Regression 4.410 3 1.470 11.344 .000
Residual 13.216 102 0.130
Total 17.626 105
a. Dependent Variable: IMP_AVG
b. Predictors: (Constant), SOC3, SOC2, SOC1
Table 6.0
280