
Page 345 - MARSIUM'21 COMP OF PAPER
P. 345
3.7 Research Intervention
The effects of an intervention on a certain outcome or interest are studied in intervention research. The main goal of
intervention research is to produce a desirable outcome for the people who need it. As a result, intervention research differs from
prevention research, in which the goal is to avoid a negative consequence, or even traditional laboratory experimentation, in
which the goal is frequently to validate specific principles of theoretical paradigms.
In this research, researcher plan to propose a loyalty program as a intervention for the problem that state at the Chapter
1. The loyalty program divide by three part which is reward points, punch card and cash back.
Reward points are a type of incentive earned through making purchases. For example, customer will earn 1 point when
they spend for every RM2. The points can use to redeem certain products that offer by Only U Mobile Enterprise. Punch card is
a token that lets a customer earn free product/service or discounts after a certain number of purchases. For example, researcher
propose a 10 times purchases get 10% discounts on the next purchases on Only U Mobile Enterprise and need to show the punch
card while making the payment. Cash back is a loyalty program that encourages customers by giving back a certain percentage
of the amount spent. For example, when customer spent a minimum RM100 per transaction at Only U Mobile Enterprise,
customer will get a certain percentage of cash back.
⬛ 4.0 DATA ANALYSIS AND FINDINGS
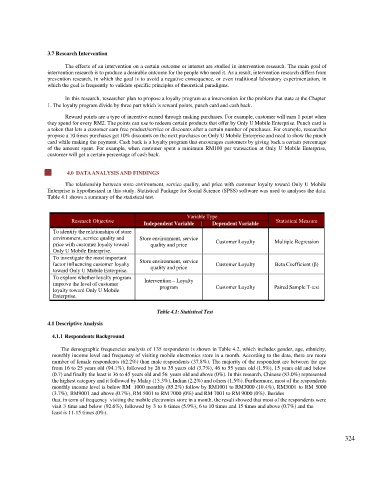
The relationship between store environment, service quality, and price with customer loyalty toward Only U Mobile
Enterprise is hypothesized in this study. Statistical Package for Social Science (SPSS) software was used to analyses the data.
Table 4.1 shows a summary of the statistical test.
Variable Type
Research Objective Statistical Measure
Independent Variable Dependent Variable
To identify the relationships of store
environment, service quality and Store environment, service
price with customer loyalty toward quality and price Customer Loyalty Multiple Regression
Only U Mobile Enterprise.
To investigate the most important
factor influencing customer loyalty Store environment, service Customer Loyalty Beta Coefficient (β)
quality and price
toward Only U Mobile Enterprise.
To explore whether loyalty program Intervention – Loyalty
improve the level of customer
loyalty toward Only U Mobile program Customer Loyalty Paired Sample T-test
Enterprise.
Table 4.1: Statistical Test
4.1 Descriptive Analysis
4.1.1 Respondents Background
The demographic frequencies analysis of 135 respondents is shown in Table 4.2, which includes gender, age, ethnicity,
monthly income level and frequency of visiting mobile electronics store in a month. According to the data, there are more
number of female respondents (62.2%) than male respondents (37.8%). The majority of the respondent are between the age
from 16 to 25 years old (94.1%), followed by 26 to 35 years old (3.7%), 46 to 55 years old (1.5%), 15 years old and below
(0.7) and finally the least is 36 to 45 years old and 56 years old and above (0%). In this research, Chinese (83.0%) represented
the highest category and it followed by Malay (13.3%), Indian (2.2%) and others (1.5%). Furthermore, most of the respondents
monthly income level is below RM 1000 monthly (85.2%) follow by RM1001 to RM3000 (10.4%), RM 3001 to RM 5000
(3.7%), RM9001 and above (0.7%), RM 5001 to RM 7000 (0%) and RM 7001 to RM 9000 (0%). Besides
that, in term of frequency visiting the mobile electronics store in a month, the result showed that most of the respondents were
visit 3 time and below (92.6%), followed by 3 to 6 times (5.9%), 6 to 10 times and 15 times and above (0.7%) and the
least is 11-15 times (0%).
324