
Page 344 - MARSIUM'21 COMP OF PAPER
P. 344
As references from earlier research were modified to suit this study, as well as to assure the reliability and validity of
items, the instrument was adapted from a variety of constructs in the literature.
The variables were assessed by using questionnaires that were distributed via Google Form. The questionnaire
comprised of three sections; Sections A to C. All of the questions in Sections A, B, and C must be answered by respondents.
Respondents must complete Section A, which includes demographic questions such as gender, age, ethnicity, monthly income
level, and frequency of visiting a mobile electronics store in a month before going to the next section. Section B lists the three
factors of independent variable (store environment, service quality, price) while the questions in Section C are about the
dependent variable (customer loyalty). Section B and C will be measured by 5-point Likert Scale. Respondents were asked to
answered by 1 to 5 where “1” is represents strongly disagree and “5” is represents strongly agree. Respondents are required to
answer all of the questions completely.
Section: Content
Section A Demographic profile
Section B Independent variables (IV) – Store Environment, Service Quality and Price
Section C Dependent variables (DV) – Customer Loyalty
Table 3.1: Sections of Questionnaire
3.6 Data Analysis Design
The Social Sciences Statistical Package (SPSS) will used to analyse the data from this study. SPSS is a reliable,
comprehensive, and effective software application that is used to examine the relationship between the independent variables
(store environment, service quality and price) and dependent variable (customer loyalty) towards Only U Mobile Enterprise.
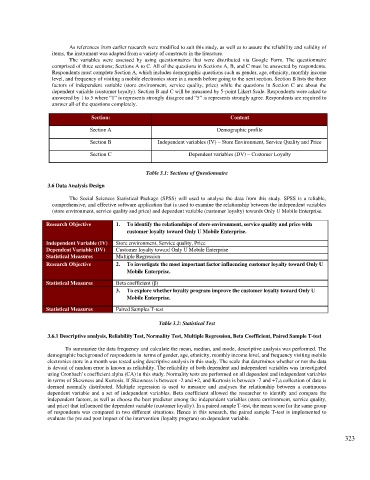
Research Objective 1. To identify the relationships of store environment, service quality and price with
customer loyalty toward Only U Mobile Enterprise.
Independent Variable (IV) Store environment, Service quality, Price
Dependent Variable (DV) Customer loyalty toward Only U Mobile Enterprise
Statistical Measures Multiple Regression
Research Objective 2. To investigate the most important factor influencing customer loyalty toward Only U
Mobile Enterprise.
Statistical Measures Beta coefficient (β)
3. To explore whether loyalty program improve the customer loyalty toward Only U
Mobile Enterprise.
Statistical Measures Paired Samples T-test
Table 3.2: Statistical Test
3.6.1 Descriptive analysis, Reliability Test, Normality Test, Multiple Regression, Beta Coefficient, Paired Sample T-test
To summarize the data frequency and calculate the mean, median, and mode, descriptive analysis was performed. The
demographic background of respondents in terms of gender, age, ethnicity, monthly income level, and frequency visiting mobile
electronics store in a month was tested using descriptive analysis in this study. The scale that determines whether or not the data
is devoid of random error is known as reliability. The reliability of both dependent and independent variables was investigated
using Cronbach’s coefficient alpha (CA) in this study. Normality tests are performed on all dependent and independent variables
in terms of Skewness and Kurtosis. If Skewness is between -2 and +2, and Kurtosis is between -7 and +7, a collection of data is
deemed normally distributed. Multiple regression is used to measure and analyses the relationship between a continuous
dependent variable and a set of independent variables. Beta coefficient allowed the researcher to identify and compare the
independent factors, as well as choose the best predictor among the independent variables (store environment, service quality,
and price) that influenced the dependent variable (customer loyalty). In a paired sample T-test, the mean score for the same group
of respondents was compared in two different situations. Hence in this research, the paired sample T-test is implemented to
evaluate the pre and post impact of the intervention (loyalty program) on dependent variable.
323