
Page 347 - MARSIUM'21 COMP OF PAPER
P. 347
Items Number of Cronbach’s
Variables Relationship
Items Alpha
“The physical facilities at stores are visually
appealing”.
‘The store layout makes it easy for
customers to find what they need“.
“The store layout makes it easy for
Store Environment 5 0.799 High
customers to move around in the shop”.
“The overall lighting level in the store
environment is appropriate”.
“The temperature in the store environment is
comfortable”.
“Generally, the employees of the company
are approachable and easy to contact”.
“Generally, the employees of the company
firm make the effort to understand my
needs”.
“Generally, the employees of the company
provide service reliably, consistently, and
Service Quality 5 0.919 Excellent
dependably“.
“Generally, the employees of the company
are willing and able to provide service in a
timely manner“.
“Generally, the employees of the company
are competent (i.e., knowledgeable and
skillful)”.
“The price I paid was honest”.
“The price I paid was justified”.
Price “The prices of the product is an acceptable 4 0.905 Excellent
level”.
“The prices of the product is reasonable”.
“I consider the company as my first choice”.
“I will patronize the company more in the
next few years”.
Customer Loyalty 4 0.912 Excellent
“I have encouraged others to patronize the
company”.
“I feel better when I go to this company”.
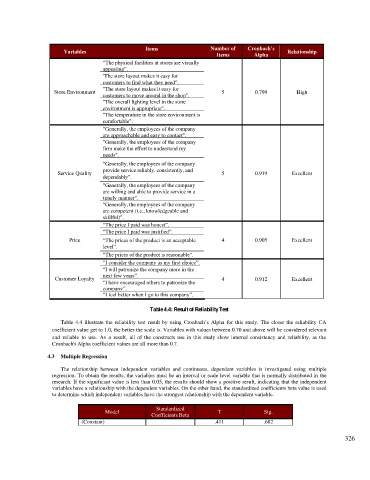
Table 4.4: Result of Reliability Test
Table 4.4 illustrate the reliability test result by using Cronbach’s Alpha for this study. The closer the reliability CA
coefficient value get to 1.0, the better the scale is. Variables with values between 0.70 and above will be considered relevant
and reliable to use. As a result, all of the constructs use in this study show internal consistency and reliability, as the
Cronbach's Alpha coefficient values are all more than 0.7.
4.3 Multiple Regression
The relationship between independent variables and continuous, dependent variables is investigated using multiple
regression. To obtain the results, the variables must be an interval or scale level variable that is normally distributed in the
research. If the significant value is less than 0.05, the results should show a positive result, indicating that the independent
variables have a relationship with the dependent variables. On the other hand, the standardized coefficients beta value is used
to determine which independent variables have the strongest relationship with the dependent variable.
Standardized
Model T Sig.
Coefficients Beta
(Constant) .411 .682
326