
Page 346 - MARSIUM'21 COMP OF PAPER
P. 346
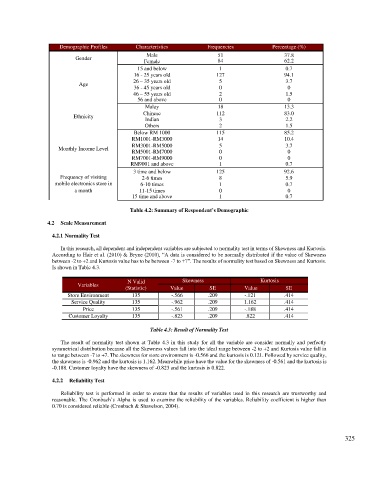
Demographic Profiles     Characteristics         Frequencies          Percentage (%)
                                                 Male                    51                    37.8
                          Gender
                                                 Female                  84                    62.2
                                              15 and below                1                     0.7
                                             16 - 25 years old           127                   94.1
                           Age               26 – 35 years old            5                     3.7
                                             36 - 45 years old            0                     0
                                             46 – 55 years old            2                     1.5
                                               56 and above               0                     0
                                                 Malay                   18                    13.3
                                                Chinese                  112                   83.0
                         Ethnicity
                                                 Indian                   3                     2.2
                                                 Others                   2                     1.5
                                             Below RM 1000               115                   85.2
                                             RM1001-RM3000               14                    10.4
                                             RM3001-RM5000                5                     3.7
                    Monthly Income Level
                                             RM5001-RM7000                0                     0
                                             RM7001-RM9000                0                     0
                                            RM9001 and above              1                     0.7
                                             3 time and below            125                   92.6
                     Frequency of visiting      2-6 times                 8                     5.9
                   mobile electronics store in   6-10 times               1                     0.7
                          a month              11-15 times                0                     0
                                             15 time and above            1                     0.7

                                            Table 4.2: Summary of Respondent’s Demographic

                 4.2  Scale Measurement

                  4.2.1 Normality Test

                     In this research, all dependent and independent variables are subjected to normality test in terms of Skewness and Kurtosis.
                  According to Hair et al. (2010) & Bryne (2010), “A data is considered to be normally distributed if the value of Skewness
                  between -2 to +2 and Kurtosis value has to be between -7 to +7”. The results of normality test based on Skewness and Kurtosis.
                  Is shown in Table 4.3.

                                           N Valid           Skewness                  Kurtosis
                           Variables
                                           (Statistic)   Value        SE          Value         SE
                       Store Environment     135          -.566       .209        -.121        .414
                         Service Quality     135          -.962       .209        1.162        .414
                            Price            135          -.561       .209        -.188        .414
                        Customer Loyalty     135          -.823       .209        .822         .414

                                                   Table 4.3: Result of Normality Test

                     The result of normality test shown at  Table 4.3 in this study for all the variable are consider normally and perfectly
                  symmetrical distribution because all the Skewness values fall into the ideal range between -2 to +2 and Kurtosis value fall in
                  to range between -7 to +7. The skewness for store environment is -0.566 and the kurtosis is 0.121. Followed by service quality,
                  the skewness is -0.962 and the kurtosis is 1.162. Meanwhile price have the value for the skewness of -0.561 and the kurtosis is
                  -0.188. Customer loyalty have the skewness of -0.823 and the kurtosis is 0.822.

                  4.2.2  Reliability Test

                     Reliability  test  is performed  in order to  ensure  that  the  results of variables used in  this  research  are  trustworthy  and
                  reasonable.  The  Cronbach’s  Alpha  is  used  to examine the reliability of the variables. Reliability coefficient is higher than
                  0.70 is considered reliable (Cronbach & Shavelson, 2004).


                                                                                                                   325