
Page 348 - MARSIUM'21 COMP OF PAPER
P. 348
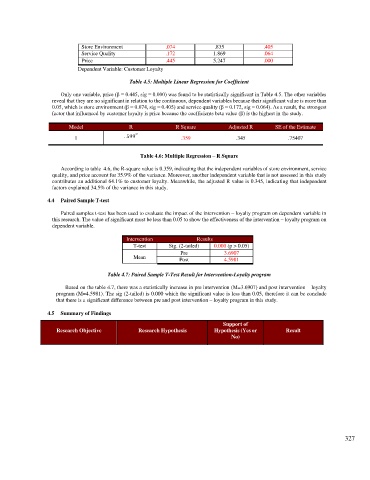
Store Environment           .074            .835            .405
                            Service Quality             .172            1.869           .064
                            Price                       .445            5.247           .000
                           Dependent Variable: Customer Loyalty

                                            Table 4.5: Multiple Linear Regression for Coefficient

                     Only one variable, price (β = 0.445, sig = 0.000) was found to be statistically significant in Table 4.5. The other variables
                  reveal that they are no significant in relation to the continuous, dependent variables because their significant value is more than
                  0.05, which is store environment (β = 0.074, sig = 0.405) and service quality (β = 0.172, sig = 0.064). As a result, the strongest
                  factor that influenced by customer loyalty is price because the coefficients beta value (β) is the highest in the study.

                        Model               R              R Square          Adjusted R     SE of the Estimate

                          1               . 599              .359              .345             .75407

                                               Table 4.6: Multiple Regression – R Square

                     According to table  4.6, the R-square value is 0.359, indicating that the independent variables of store environment, service
                  quality, and price account for 35.9% of the variance. Moreover, another independent variable that is not assessed in this study
                  contributes an additional 64.1% to customer loyalty. Meanwhile, the adjusted R value is 0.345, indicating that independent
                  factors explained 34.5% of the variance in this study.

                 4.4  Paired Sample T-test

                     Paired samples t-test has been used to evaluate the impact of the intervention – loyalty program on dependent variable in
                  this research. The value of significant must be less than 0.05 to show the effectiveness of the intervention – loyalty program on
                  dependent variable.

                                           Intervention           Results
                                             T-test      Sig. (2-tailed)   0.000 (p > 0.05)
                                                             Pre           3.6907
                                             Mean           Post           4.5981

                                     Table 4.7: Paired Sample T-Test Result for Intervention-Loyalty program

                       Based on the table 4.7, there was a statistically increase in pre intervention (M=3.6907) and post intervention – loyalty
                    program (M=4.5981). The sig (2-tailed) is 0.000 which the significant value is less than 0.05, therefore it can be conclude
                    that there is a significant difference between pre and post intervention – loyalty program in this study.

                 4.5  Summary of Findings

                                                                           Support of
                    Research Objective         Research Hypothesis      Hypothesis (Yes or      Result
                                                                              No)


                                                                                                                   327