
Page 449 - MARSIUM'21 COMP OF PAPER
P. 449
428 Qayum & Mazilah (2021)
4.3 Validity Analysis
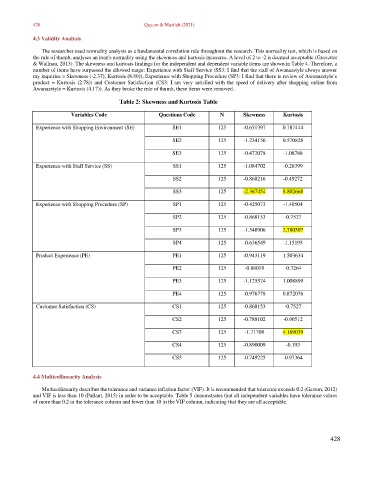
The researcher used normality analysis as a fundamental correlation rule throughout the research. This normality test, which is based on
the rule of thumb, analyses an item's normality using the skewness and kurtosis measures. A level of 2 to -2 is deemed acceptable (Gravetter
& Wallnau, 2013). The skewness and kurtosis findings for the independent and dependent variable items are shown in Table 4. Therefore, a
number of items have surpassed the allowed range: Experience with Staff Service (SS3: I find that the staff of Awanazstyle always answer
my inquiries = Skewness (-2.37), Kurtosis (8.80)), Experience with Shopping Procedure (SP3: I find that there is review of Awanazstyle’s
product = Kurtosis (2.78)) and Customer Satisfaction (CS3: I am very satisfied with the speed of delivery after shopping online from
Awanazstyle = Kurtosis (4.17)). As they broke the rule of thumb, these items were removed.
Table 2: Skewness and Kurtosis Table
Variables Code Questions Code N Skewness Kurtosis
Experience with Shopping Environment (SE) SE1 125 -0.651397 0.787444
SE2 125 -1.234156 0.570828
SE3 125 -0.472078 -1.08788
Experience with Staff Service (SS) SS1 125 -1.084702 -0.26399
SS2 125 -0.868216 -0.49272
SS3 125 -2.367454 8.802668
Experience with Shopping Procedure (SP) SP1 125 -0.425073 -1.40504
SP2 125 -0.868153 -0.7527
SP3 125 -1.548906 2.780507
SP4 125 -0.636549 -1.15195
Product Experience (PE) PE1 125 -0.943119 1.503634
PE2 125 -0.88018 -0.3264
PE3 125 -1.125574 1.008899
PE4 125 -0.976778 0.872076
Customer Satisfaction (CS) CS1 125 -0.868153 -0.7527
CS2 125 -0.788102 -0.90512
CS3 125 -1.71708 4.169039
CS4 125 -0.890009 -0.193
CS5 125 -0.749225 -0.97364
4.4 Multicollinearity Analysis
Multicollinearity describes the tolerance and variance inflation factor (VIF). It is recommended that tolerance exceeds 0.2 (Garson, 2012)
and VIF is less than 10 (Pallant, 2015) in order to be acceptable. Table 5 demonstrates that all independent variables have tolerance values
of more than 0.2 in the tolerance column and fewer than 10 in the VIF column, indicating that they are all acceptable.
428