
Page 450 - MARSIUM'21 COMP OF PAPER
P. 450
429 Qayum & Mazilah (2021)
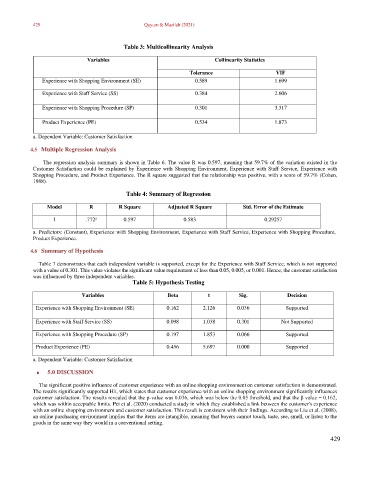
Table 3: Multicollinearity Analysis
Variables Collinearity Statistics
Tolerance VIF
Experience with Shopping Environment (SE) 0.589 1.699
Experience with Staff Service (SS) 0.384 2.606
Experience with Shopping Procedure (SP) 0.301 3.317
Product Experience (PE) 0.534 1.873
a. Dependent Variable: Customer Satisfaction
4.5 Multiple Regression Analysis
The regression analysis summary is shown in Table 6. The value R was 0.597, meaning that 59.7% of the variation existed in the
Customer Satisfaction could be explained by Experience with Shopping Environment, Experience with Staff Service, Experience with
Shopping Procedure, and Product Experience. The R square suggested that the relationship was positive, with a score of 59.7% (Cohen,
1988).
Table 4: Summary of Regression
Model R R Square Adjusted R Square Std. Error of the Estimate
a
1 .772 0.597 0.583 0.29257
a. Predictors: (Constant), Experience with Shopping Environment, Experience with Staff Service, Experience with Shopping Procedure,
Product Experience.
4.6 Summary of Hypothesis
Table 7 demonstrates that each independent variable is supported, except for the Experience with Staff Service, which is not supported
with a value of 0.301. This value violates the significant value requirement of less than 0.05, 0.005, or 0.001. Hence, the customer satisfaction
was influenced by three independent variables.
Table 5: Hypothesis Testing
Variables Beta t Sig. Decision
Experience with Shopping Environment (SE) 0.162 2.126 0.036 Supported
Experience with Staff Service (SS) 0.098 1.038 0.301 Not Supported
Experience with Shopping Procedure (SP) 0.197 1.853 0.066 Supported
Product Experience (PE) 0.456 5.697 0.000 Supported
a. Dependent Variable: Customer Satisfaction
■ 5.0 DISCUSSION
The significant positive influence of customer experience with an online shopping environment on customer satisfaction is demonstrated.
The results significantly supported H1, which states that customer experience with an online shopping environment significantly influences
customer satisfaction. The results revealed that the p-value was 0.036, which was below the 0.05 threshold, and that the β value = 0.162,
which was within acceptable limits. Pei et al. (2020) conducted a study in which they established a link between the customer's experience
with an online shopping environment and customer satisfaction. This result is consistent with their findings. According to Liu et al. (2008),
an online purchasing environment implies that the items are intangible, meaning that buyers cannot touch, taste, see, smell, or listen to the
goods in the same way they would in a conventional setting.
429