
Page 478 - MARSIUM'21 COMP OF PAPER
P. 478
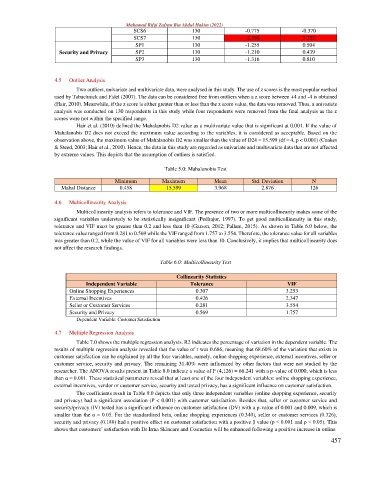
Muhamad Rifqi Zafran Bin Abdul Hakim (2022)
                                             SCS6                130              -0.775             -0.370
                                             SCS7                130              -2.350             7.352
                                              SP1                130              -1.255             0.504
                     Security and Privacy     SP2                130              -1.210             0.439
                                              SP3                130              -1.316             0.810


                   4.5   Outlier Analysis
                          Two outliers, univariate and multivariate data, were analysed in this study. The use of z scores is the most popular method
                   used by Tabachnick and Fidel (2007). The data can be considered free from outliers when a z score between +4 and -4 is obtained
                   (Hair, 2010). Meanwhile, if the z score is either greater than or less than the z score value, the data was removed. Thus, a univariate
                   analysis was conducted on 130 respondents in this study while four respondents were removed from the final analysis as the z
                   scores were not within the specified range.
                          Hair et al. (2010) defined the Mahalanobis D2 value as a multivariate value that is significant at 0.001. If the value of
                   Mahalanobis D2 does not exceed the maximum value according to the variables, it is considered as acceptable. Based on the
                   observation above, the maximum value of Mahalanobis D2 was smaller than the value of D24 = 15.599 (df = 4, p < 0.001) (Coakes
                   & Steed, 2003; Hair et al., 2010). Hence, the data in this study are regarded as univariate and multivariate data that are not affected
                   by extreme values. This depicts that the assumption of outliers is satisfied.

                                                        Table 5.0: Mahalanobis Test

                                       Minimum         Maximum          Mean        Std. Deviation      N
                     Mahal Distance      0.458          15.599          3.968           2.876           126

                   4.6   Multicollinearity Analysis
                          Multicollinearity analysis refers to tolerance and VIF. The presence of two or more multicollinearity makes some of the
                   significant  variables  understudy to be  statistically  insignificant  (Pedhajur, 1997).  To get  good  multicollinearity  in  this  study,
                   tolerance and VIF must be greater than 0.2 and less than 10 (Garson, 2012; Pallant, 2015). As shown in Table 6.0 below, the
                   tolerance value ranged from 0.281 to 0.569 while the VIF ranged from 1.757 to 3.554. Therefore, the tolerance value for all variables
                   was greater than 0.2, while the value of VIF for all variables were less than 10. Conclusively, it implies that multicollinearity does
                   not affect the research findings.

                                                      Table 6.0: Multicollinearity Test

                                                           Collinearity Statistics
                             Independent Variable               Tolerance                       VIF
                        Online Shopping Experiences               0.307                         3.253
                        External Incentives                       0.426                         2.347
                        Seller or Customer Services               0.281                         3.554
                        Security and Privacy                      0.569                         1.757
                          Dependent Variable: Customer Satisfaction

                   4.7   Multiple Regression Analysis
                          Table 7.0 shows the multiple regression analysis. R2 indicates the percentage of variation in the dependent variable. The
                   results of multiple regression analysis revealed that the value of r was 0.686, meaning that 68.60% of the variation that exists in
                   customer satisfaction can be explained by all the four variables, namely, online shopping experience, external incentives, seller or
                   customer service, security and privacy. The remaining 31.40% were influenced by other factors that were not studied by the
                   researcher. The ANOVA results present in Table 8.0 indicate a value of F (4,126) = 66.241 with a p-value of 0.000, which is less
                   than α = 0.001. These statistical parameters reveal that at least one of the four independent variables: online shopping experience,
                   external incentives, vendor or customer service, security and tested privacy, has a significant influence on customer satisfaction.
                          The coefficients result in Table 9.0 depicts that only three independent variables (online shopping experience, security
                   and privacy) had a significant association (P < 0.001) with customer satisfaction. Besides that, seller or customer service and
                   security/privacy (IV) tested has a significant influence on customer satisfaction (DV) with a p-value of 0.001 and 0.009, which is
                   smaller than the α = 0.05. For the standardised beta, online shopping experiences (0.340), seller or customer services (0.326),
                   security and privacy (0.180) had a positive effect on customer satisfaction with a positive β value (p < 0.001 and p < 0.05). This
                   shows that customers’ satisfaction with Dr Irma Skincare and Cosmetics will be enhanced following a positive increase in online

                                                                                                               457