Page 477 - MARSIUM'21 COMP OF PAPER
P. 477

Muhamad Rifqi Zafran Bin Abdul Hakim (2022)

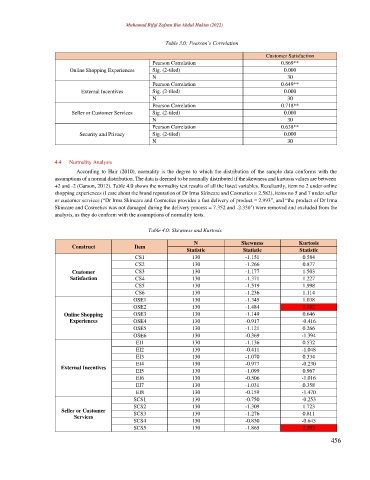
                                                        Table 3.0: Pearson’s Correlation

                                                                                         Customer Satisfaction
                                                    Pearson Correlation                       0.869**
                        Online Shopping Experiences   Sig. (2-tiled)                           0.000
                                                    N                                           30
                                                    Pearson Correlation                       0.649**
                            External Incentives     Sig. (2-tiled)                             0.000
                                                    N                                           30
                                                    Pearson Correlation                       0.718**
                         Seller or Customer Services   Sig. (2-tiled)                          0.000
                                                    N                                           30
                                                    Pearson Correlation                       0.638**
                           Security and Privacy     Sig. (2-tiled)                             0.000
                                                    N                                           30


                   4.4   Normality Analysis
                          According  to  Hair  (2010),  normality  is  the  degree  to  which the  distribution of  the  sample  data  conforms  with  the
                   assumptions of a normal distribution. The data is deemed to be normally distributed if the skewness and kurtosis values are between
                   +2 and -2 (Garson, 2012). Table 4.0 shows the normality test results of all the listed variables. Resultantly, item no 2 under online
                   shopping experiences (I care about the brand reputation of Dr Irma Skincare and Cosmetics = 2.582), items no 5 and 7 under seller
                   or customer services (“Dr Irma Skincare and Cosmetics provides a fast delivery of product = 2.993”, and “the product of Dr Irma
                   Skincare and Cosmetics was not damaged during the delivery process = 7.352 and -2.350’) were removed and excluded from the
                   analysis, as they do conform with the assumptions of normality tests.

                                                  Table 4.0: Skewness and Kurtosis

                                                                 N               Skewness           Kurtosis
                         Construct            Item
                                                               Statistic          Statistic         Statistic
                                              CS1                130              -1.151             0.584
                                              CS2                130              -1.266             0.877
                         Customer             CS3                130              -1.177             1.503
                        Satisfaction          CS4                130              -1.371             1.227
                                              CS5                130              -1.519             1.998
                                              CS6                130              -1.236             1.114
                                             OSE1                130              -1.345             1.038
                                             OSE2                130              -1.484             2.582
                      Online Shopping        OSE3                130              -1.149             0.646
                        Experiences          OSE4                130              -0.917             -0.416
                                             OSE5                130              -1.121             0.266
                                             OSE6                130              -0.369             -1.394
                                              EI1                130              -1.136             0.532
                                              EI2                130              -0.411             -1.048
                                              EI3                130              -1.070             0.334
                                              EI4                130              -0.977             -0.230
                     External Incentives
                                              EI5                130              -1.099             0.967
                                              EI6                130              -0.506             -1.016
                                              EI7                130              -1.031             0.358
                                              EI8                130              -0.159             -1.470
                                             SCS1                130              -0.750             -0.253
                                             SCS2                130              -1.309             1.723
                     Seller or Customer      SCS3                130              -1.276             0.811
                          Services
                                             SCS4                130              -0.830             -0.645
                                             SCS5                130              -1.865             2.993

                                                                                                               456
   472   473   474   475   476   477   478   479   480   481   482