
Page 476 - MARSIUM'21 COMP OF PAPER
P. 476
Muhamad Rifqi Zafran Bin Abdul Hakim (2022)
3.4 Data Analysis
The Statistical Package for Social Science was used to analyze the data acquired in this study (SPSS). This study employed
percentage and frequency to analyze the demographics of the respondents. The statistical tests employed in this study are summarized
below:
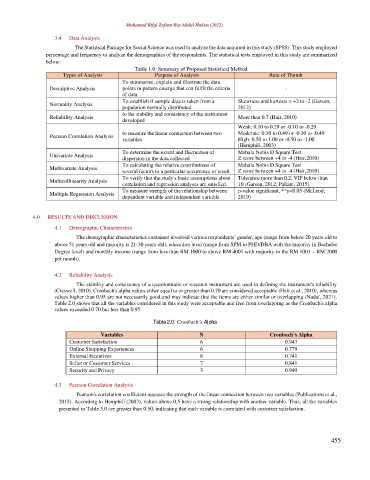
Table 1.0: Summary of Proposed Statistical Method
Types of Analysis Purpose of Analysis Rule of Thumb
To summarize, explain and illustrate the data
Descriptive Analysis points in pattern emerge that can fulfil the criteria -
of data.
To establish if sample data is taken from a Skewness and kurtosis = +2 to -2 (Garson,
Normality Analysis
population normally distributed 2012)
to the stability and consistency of the instrument
Reliability Analysis More than 0.7 (Hair, 2010)
developed
Weak: 0.10 to 0.29 or -0.10 to -0.29
Pearson Correlation Analysis to measure the linear connection between two Moderate: 0.30 to 0.49 or -0.30 to -0.49
variables High: 0.50 to 1.00 or -0.50 to -1.00
(Hemphill, 2003)
To determine the extent and fluctuation of Mahala Nobis D Square Test
Univariate Analysis
dispersion in the data collected Z score between +4 to -4 (Hair,2010)
To calculating the relative contributions of Mahala Nobis D Square Test
Multivariate Analysis
several factors to a particular occurrence or result Z score between +4 to -4 (Hair,2010)
To verify that the study's basic assumptions about Tolerance more than 0.2; VIF below than
Multicollinearity Analysis
correlation and regression analyses are satisfied. 10 (Garson, 2012; Pallant, 2015)
To measure strength of the relationship between p-value significant, **p<0.05 (McLeod,
Multiple Regression Analysis
dependent variable and independent variable 2019)
4.0 RESULTS AND DISCUSSION
4.1 Demographic Characteristics
The demographic characteristics contained involved various respondents’ gender, age (range from below 20 years old to
above 51 years old and majority is 21-30 years old), education level (range from SPM to PHD/DBA with the majority in Bachelor
Degree level) and monthly income (range from less than RM 1000 to above RM 4001 with majority in the RM 1001 – RM 2000
per month).
4.2 Reliability Analysis
The stability and consistency of a questionnaire or research instrument are used in defining the instrument's reliability
(Creswell, 2010). Cronbach's alpha values either equal to or greater than 0.70 are considered acceptable (Hair et al., 2010), whereas
values higher than 0.95 are not necessarily good and may indicate that the items are either similar or overlapping (Nadaf, 2021).
Table 2.0 shows that all the variables considered in this study were acceptable and free from overlapping as the Cronbach's alpha
values exceeded 0.70 but less than 0.95.
Table 2.0: Cronbach’s Alpha
Variables N Cronbach’s Alpha
Customer Satisfaction 6 0.943
Online Shopping Experiences 6 0.779
External Incentives 8 0.741
Seller or Customer Services 7 0.841
Security and Privacy 3 0.940
4.3 Pearson Correlation Analysis
Pearson's correlation coefficient assesses the strength of the linear connection between two variables (Publications et al.,
2015). According to Hemphill (2003), values above 0.5 have a strong relationship with another variable. Thus, all the variables
presented in Table 3.0 are greater than 0.50, indicating that each variable is correlated with customer satisfaction.
455