
Page 503 - MARSIUM'21 COMP OF PAPER
P. 503
and is regarded as an appropriate level while doing research. According to Mumtaz et al. (2020), a carefully selected small sample 100 and
above is more meaningful than a blindly selected large sample 300 and above. Therefore, the study uses a sample size of 122. Furthermore,
the non-probability sampling methodology was used, where judgmental sampling method aimed to collect data from Facebook consumers who
had intention to purchase of plumbing and maintenance services, as well as they had a retail store, residential home, restaurant and grocery,
public and private institution, warehouse, office, and hotel that require plumbing and maintenance services.
3.3 RESEARCH INSTRUMENT
This study adopted the quantitative methods using a questionnaire survey tool to collect the primary data of online respondents in
a Google form format. The questionnaire includes 6 sections, specifically Section A (demographic profile), Section B (product), Section C
(price), Section D (place), Section E (promotion), and Section F (purchase intention). Part A contains ten questions about the demographic
characteristics of the interviewee, such as age, gender, country of origin, occupation, and income level. In Parts B, C, D, and E, 11 questions
related to respondents’ views on possible factors affecting the 4P of the marketing mix; product, price, location, and promotion. The other four
questions in Part F are the customer’s intention to purchase related services.
These items are taken over and adapted from existing tools that measure product, price, location, advertising, and purchase intention (Saaty
& Ansari, 2011). The objective of this measure is to investigate the impact of 4P marketing mix on consumers’ purchasing intentions. The 5-
point Likert scale was used in Part B of the questionnaire, ranging from 1 (strongly disagree, 2 (disagree), 3 (neutral), 4 (agree), and 5 (strongly
agree) using Statistical Package for the Social Science (SPPSS) for processing and analysis information.
⬛ 4.0 DATA ANALYSIS AND RESULTS
4.1 FINDINGS AND ANALYSIS
Data analysis was conducted through collected questionnaire and 122 questionnaires were distributed to the target respondents
using Google form. SPSS was used to analyse the data collected by using the technique such as normality test, descriptive analysis, reliability
test and multiple regression.
4.2 RESPONSE RATE
The online questionnaire was created using Google forms and sent to the respondents via multiple social media platforms. The
target respondents were selected based on the requirement for those who have a retail store, residential home, restaurant and grocery,
public and private institution, warehouse, office, and hotel that require plumbing and maintenance services. However, this study adopted a
judgmental sampling technique to collect the data. A total of 173 sets of questionnaires were sent out, and 122 sets of questionnaires were
returned. Therefore, the usable questionnaires were 122 sets with a response rate of 70.52%.
4.3 DESCRIPTIVE ANALYSIS
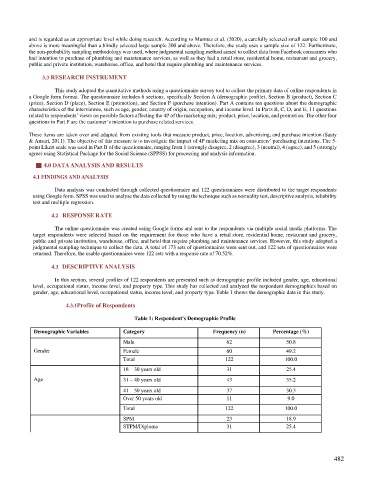
In this section, several profiles of 122 respondents are presented such as demographic profile included gender, age, educational
level, occupational status, income level, and property type. This study has collected and analyzed the respondent demographics based on
gender, age, educational level, occupational status, income level, and property type. Table 1 shows the demographic data in this study.
4.3.1 Profile of Respondents
Table 1: Respondent’s Demographic Profile
Demographic Variables Category Frequency (n) Percentage (%)
Male 62 50.8
Gender Female 60 49.2
Total 122 100.0
18 – 30 years old 31 25.4
Age 31 – 40 years old 43 35.2
41 – 50 years old 37 30.3
Over 50 years old 11 9.0
Total 122 100.0
SPM 23 18.9
STPM/Diploma 31 25.4
482