
Page 505 - MARSIUM'21 COMP OF PAPER
P. 505
third-highest value of mean is the price (3.83). On the other hand, there are two variables with the lowest means value: promotion (3.73) and
place (3.63). Meanwhile, for the standard deviation, the highest dispersion was attained by promotion which is 1.14. This is followed by
place (0.73), price (0.72), purchase intention (0.70), and product (0.63).
4.4 NORMALITY TEST
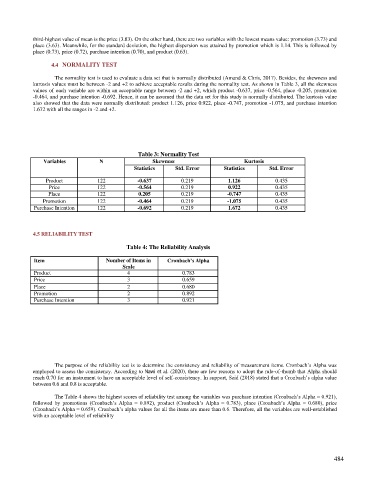
The normality test is used to evaluate a data set that is normally distributed (Amand & Chris, 2017). Besides, the skewness and
kurtosis values must be between -2 and +2 to achieve acceptable results during the normality test. As shown in Table 3, all the skewness
values of each variable are within an acceptable range between -2 and +2, which product -0.637, price -0.564, place -0.205, promotion
-0.464, and purchase intention -0.692. Hence, it can be assumed that the data set for this study is normally distributed. The kurtosis value
also showed that the data were normally distributed: product 1.126, price 0.922, place -0.747, promotion -1.075, and purchase intention
1.672 with all the ranges in -2 and +2.
Table 3: Normality Test
Variables N Skewness Kurtosis
Statistics Std. Error Statistics Std. Error
Product 122 -0.637 0.219 1.126 0.435
Price 122 -0.564 0.219 0.922 0.435
Place 122 0.205 0.219 -0.747 0.435
Promotion 122 -0.464 0.219 -1.075 0.435
Purchase Intention 122 -0.692 0.219 1.672 0.435
4.5 RELIABILITY TEST
Table 4: The Reliability Analysis
Item Number of Items in Cronbach’s Alpha
Scale
Product 4 0.783
Price 3 0.659
Place 2 0.680
Promotion 2 0.892
Purchase Intention 3 0.921
The purpose of the reliability test is to determine the consistency and reliability of measurement items. Cronbach’s Alpha was
employed to assess the consistency. According to Nawi et al. (2020), there are few reasons to adopt the rule-of-thumb that Alpha should
reach 0.70 for an instrument to have an acceptable level of self-consistency. In support, Said (2018) stated that a Cronbach’s alpha value
between 0.6 and 0.8 is acceptable.
The Table 4 shows the highest scores of reliability test among the variables was purchase intention (Cronbach’s Alpha = 0.921),
followed by promotions (Cronbach’s Alpha = 0.892), product (Cronbach’s Alpha = 0.783), place (Cronbach’s Alpha = 0.680), price
(Cronbach’s Alpha = 0.659). Cronbach’s alpha values for all the items are more than 0.6. Therefore, all the variables are well-established
with an acceptable level of reliability
484