
Page 504 - MARSIUM'21 COMP OF PAPER
P. 504
Bachelor 37 30.3
Education Level Master/MBA 17 13.9
PhD/DBA 12 9.8
Other 2 1.7
Total 122 100.0
Employee 58 47.5
Unemployed 5 4.1
Occupational Status Self-employed 32 26.2
Retired 9 7.4
Full-time students 18 14.8
Total 122 100.0
Below RM2,000 34 27.9
Income Level RM2,001 – RM4,000 42 34.4
RM4,001 – RM8,000 41 33.6
Above RM8,000 5 4.1
Total 122 100.0
Own Housing 71 58.2
Property Type Rental Housing 43 35.2
Business Premise 4 3.3
Tender 4 3.3
Total 122 100.0
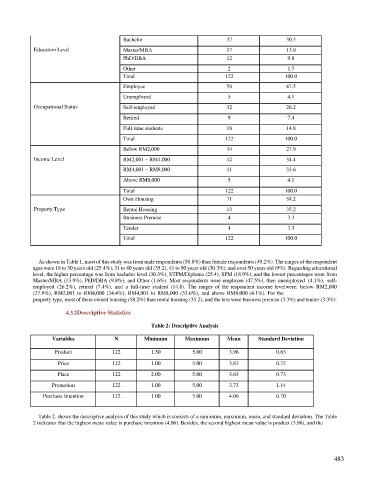
As shown in Table 1, most of this study was from male respondents (50.8%) than female respondents (49.2%). The ranges of the respondent
ages were 18 to 30 years old (25.4%), 31 to 40 years old (35.2), 41 to 50 years old (30.3%), and over 50 years old (9%). Regarding educational
level, the higher percentage was from bachelor level (30.3%), STPM/Diploma (25.4), SPM (18.9%), and the lowest percentages were from
Master/MBA (13.9%), PhD/DBA (9.8%), and Other (1.6%). Most respondents were employee (47.5%), then unemployed (4.1%), self-
employed (26.2%), retired (7.4%), and a full-time student (14.8). The ranges of the respondent income level were: below RM2,000
(27.9%), RM2,001 to RM4,000 (34.4%), RM4,001 to RM8,000 (33.6%), and above RM8,000 (4.1%). For the
property type, most of them owned housing (58.2%) than rental housing (35.2), and the less were business premise (3.3%) and tender (3.3%).
4.3.2 Descriptive Statistics
Table 2: Descriptive Analysis
Variables N Minimum Maximum Mean Standard Deviation
Product 122 1.50 5.00 3.96 0.63
Price 122 1.00 5.00 3.83 0.72
Place 122 2.00 5.00 3.63 0.73
Promotion 122 1.00 5.00 3.73 1.14
Purchase Intention 122 1.00 5.00 4.06 0.70
Table 2. shows the descriptive analysis of this study which is consists of a minimum, maximum, mean, and standard deviation. The Table
2 indicates that the highest mean value is purchase intention (4.06). Besides, the second highest mean value is product (3.96), and the
483