
Page 556 - MARSIUM'21 COMP OF PAPER
P. 556
535 Nor Khairena binti Khalid (2022)
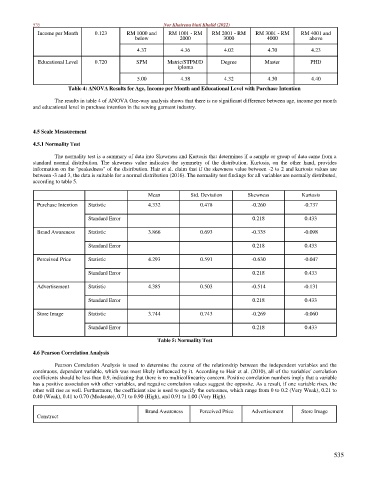
Income per Month 0.123 RM 1000 and RM 1001 - RM RM 2001 - RM RM 3001 - RM RM 4001 and
below 2000 3000 4000 above
4.37 4.36 4.02 4.70 4.23
Educational Level 0.720 SPM Matric/STPM/D Degree Master PHD
iploma
5.00 4.38 4.32 4.30 4.40
Table 4: ANOVA Results for Age, Income per Month and Educational Level with Purchase Intention
The results in table 4 of ANOVA One-way analysis shows that there is no significant difference between age, income per month
and educational level in purchase intention in the sewing garment industry.
4.5 Scale Measurement
4.5.1 Normality Test
The normality test is a summary of data into Skewness and Kurtosis that determines if a sample or group of data came from a
standard normal distribution. The skewness value indicates the symmetry of the distribution. Kurtosis, on the other hand, provides
information on the "peakedness" of the distribution. Hair et al. claim that if the skewness value between -2 to 2 and kurtosis values are
between -3 and 3, the data is suitable for a normal distribution (2016). The normality test findings for all variables are normally distributed,
according to table 5.
Mean Std. Deviation Skewness Kurtosis
Purchase Intention Statistic 4.332 0.478 -0.260 -0.737
Standard Error 0.218 0.433
Brand Awareness Statistic 3.866 0.693 -0.335 -0.098
Standard Error 0.218 0.433
Perceived Price Statistic 4.293 0.591 -0.630 -0.047
Standard Error 0.218 0.433
Advertisement Statistic 4.385 0.503 -0.514 -0.131
Standard Error 0.218 0.433
Store Image Statistic 3.744 0.743 -0.269 -0.060
Standard Error 0.218 0.433
Table 5: Normality Test
4.6 Pearson Correlation Analysis
Pearson Correlation Analysis is used to determine the course of the relationship between the independent variables and the
continuous, dependent variable, which was most likely influenced by it. According to Hair et al. (2010), all of the variables' correlation
coefficients should be less than 0.9, indicating that there is no multicollinearity concern. Positive correlation numbers imply that a variable
has a positive association with other variables, and negative correlation values suggest the opposite. As a result, if one variable rises, the
other will rise as well. Furthermore, the coefficient size is used to specify the outcomes, which range from 0 to 0.2 (Very Weak), 0.21 to
0.40 (Weak), 0.41 to 0.70 (Moderate), 0.71 to 0.90 (High), and 0.91 to 1.00 (Very High).
Brand Awareness Perceived Price Advertisement Store Image
Construct
535