
Page 554 - MARSIUM'21 COMP OF PAPER
P. 554
533 Nor Khairena binti Khalid (2022)
⬛ 4.0 FINDINGS AND ANALYSIS
4.1 Data Analysis
The Social Sciences Statistical Package was used to evaluate quantitative data from online and offline surveys (SPSS). The study
was divided into three parts, the first of which was descriptive statistics. The demographic information provided by the respondents was
analysed using the frequencies analysis, and the results indicate what the data is or implies. As a result, summarising in tables aids
comprehension of the descriptive analytical backdrop and data distribution. The data analysis was divided into two parts, the first of which
involved reviewing the measuring model and the second of which entailed building a complete structural equation model (Dhiman et al.,
2019).
The normalcy and reliability tests are measured in the first stage. The skewness and kurtosis tests were used to determine data
normality (the acceptable range for skewing is 1). The inner accuracy of problems involving the Likert scale was assessed using Cronbach's
alpha. The internal stability of the findings is commonly regarded as a range of 0 to 7. (Pallant, 2005). Pearson Correlation Analysis and
Multiple Linear Regression are used in the second step. Positive correlation coefficients show that a variable has a positive link with other
variables, whereas negative correlation coefficients indicate that a variable has a negative relationship with other variables. As a result, if
one variable rises, the other will rise as well..According to Pallant (2007), the strength of the association is determined by the data's coefficient
size. Multiple Linear Regression analysis, which is the most frequent approach for analysing quantitative data, was utilised since it is a very
effective tool for determining which relationships among the variables had the greatest impact and prediction (Ghauri et al., 2020). The R2
indicates how much variance in the dependent variable is explained by the independent variables. The higher the R2, the more variation in
the dependent variable is explained by the independent variables. Multiple Linear Regression is significant when the p-value is less than
0.05. (Lee et al., 2018). The regression's results will reveal the relationship between the independent factors and the continuous, dependent
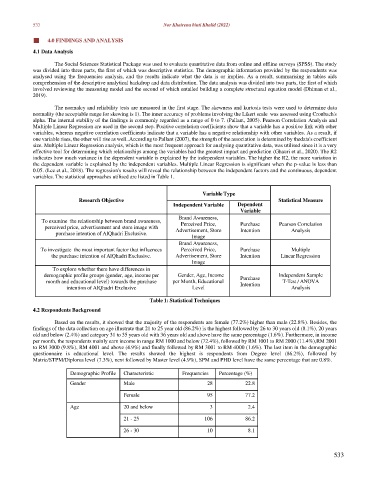
variables. The statistical approaches utilised are listed in Table 1.
Variable Type
Research Objective Statistical Measure
Independent Variable Dependent
Variable
Brand Awareness,
To examine the relationship between brand awareness, Perceived Price,
perceived price, advertisement and store image with Advertisement, Store Purchase Pearson Correlation
Intention
Analysis
purchase intention of AlQhadri Exclusive.
Image
Brand Awareness,
To investigate the most important factor that influences Perceived Price, Purchase Multiple
the purchase intention of AlQhadri Exclusive. Advertisement, Store Intention Linear Regression
Image
To explore whether there have differences in
demographic profile groups (gender, age, income per Gender, Age, Income Purchase Independent Sample
month and educational level) towards the purchase per Month, Educational Intention T-Test / ANOVA
intention of AlQhadri Exclusive Level Analysis
Table 1: Statistical Techniques
4.2 Respondents Background
Based on the results, it showed that the majority of the respondents are female (77.2%) higher than male (22.8%). Besides, the
findings of the data collection on age illustrate that 21 to 25 year old (86.2%) is the highest followed by 26 to 30 years old (8.1%), 20 years
old and below (2.4%) and category 31 to 35 years old with 36 years old and above have the same percentage (1.6%). Furthermore, in income
per month, the respondents mainly earn income in range RM 1000 and below (72.4%), followed by RM 1001 to RM 2000 (11.4%), RM 2001
to RM 3000 (9.8%), RM 4001 and above (4.9%) and finally followed by RM 3001 to RM 4000 (1.6%). The last item in the demographic
questionnaire is educational level. The results showed the highest is respondents from Degree level (86.2%), followed by
Matric/STPM/Diploma level (7.3%), next followed by Master level (4.9%), SPM and PHD level have the same percentage that are 0.8%.
Demographic Profile Characteristic Frequencies Percentage (%)
Gender Male 28 22.8
Female 95 77.2
Age 20 and below 3 2.4
21 - 25 106 86.2
26 - 30 10 8.1
533