
Page 555 - MARSIUM'21 COMP OF PAPER
P. 555
534 Nor Khairena binti Khalid (2022)
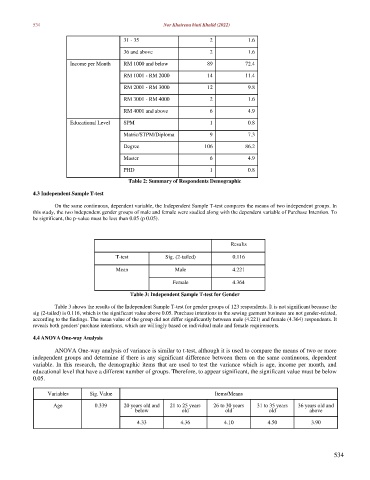
31 - 35 2 1.6
36 and above 2 1.6
Income per Month RM 1000 and below 89 72.4
RM 1001 - RM 2000 14 11.4
RM 2001 - RM 3000 12 9.8
RM 3001 - RM 4000 2 1.6
RM 4001 and above 6 4.9
Educational Level SPM 1 0.8
Matric/STPM/Diploma 9 7.3
Degree 106 86.2
Master 6 4.9
PHD 1 0.8
Table 2: Summary of Respondents Demographic
4.3 Independent Sample T-test
On the same continuous, dependent variable, the Independent Sample T-test compares the means of two independent groups. In
this study, the two independent gender groups of male and female were studied along with the dependent variable of Purchase Intention. To
be significant, the p-value must be less than 0.05 (p 0.05).
Results
T-test Sig. (2-tailed) 0.116
Mean Male 4.221
Female 4.364
Table 3: Independent Sample T-test for Gender
Table 3 shows the results of the Independent Sample T-test for gender groups of 123 respondents. It is not significant because the
sig (2-tailed) is 0.116, which is the significant value above 0.05. Purchase intentions in the sewing garment business are not gender-related,
according to the findings. The mean value of the group did not differ significantly between male (4.221) and female (4.364) respondents. It
reveals both genders' purchase intentions, which are willingly based on individual male and female requirements.
4.4 ANOVA One-way Analysis
ANOVA One-way analysis of variance is similar to t-test, although it is used to compare the means of two or more
independent groups and determine if there is any significant difference between them on the same continuous, dependent
variable. In this research, the demographic items that are used to test the variance which is age, income per month, and
educational level that have a different number of groups. Therefore, to appear significant, the significant value must be below
0.05.
Variables Sig. Value Items/Means
Age 0.339 20 years old and 21 to 25 years 26 to 30 years 31 to 35 years 36 years old and
below old old old above
4.33 4.36 4.10 4.50 3.90
534